The Chinook Report: 1H 2023
The latest bi-annual report of M&A activity, focusing on global, national, and regional (Pacific Northwest) trends. Includes profiles of transactions generally with an Enterprise Value (EV) between $10 and $100 million.
Click here to download a copy of this report.
EXECUTIVE SUMMARY
While the overall M&A market in deal size has slowed, the lower middle market deal volume continues to stay active. Deal volumes remain strong and are higher than pre-COVID levels. The first half of 2023 demonstrated a robust macroeconomic environment, proving conducive to M&A activity in the lower middle market. Lower than anticipated inflation and solid GDP growth have painted an encouraging backdrop for both buyers and sellers. These factors have instilled confidence and stimulated activity, supporting a stable climate for smaller transactions.
The current lending environment, characterized by high-interest rates, and reduced access to debt has enhanced the attractiveness of smaller deals as deal-making for larger deals has slowed. Financing instability and contractionary monetary policy resulted in barriers to obtain deal financing. In contrast to the peak valuations observed in 2021, valuation multiples have lowered across all deal sizes. However, smaller deals require less transactional financing and can close with all cash or through existing credit facilities of larger public buyers or large PE platforms.
Business owners continue to remain well-positioned to attract multiple offers from such buyers. The key drivers of healthy public valuations and the pressing need for U.S. private equity firms to invest their nearly $800 billion of dry powder paint a positive picture as we look ahead. As we navigate through the remainder of 2023, we anticipate these dynamics to play out, resulting in growth for the entire M&A market.
Chinook Capital Advisors has closed a record number of transactions since the COVID period and is on track for its sixth consecutive record year.
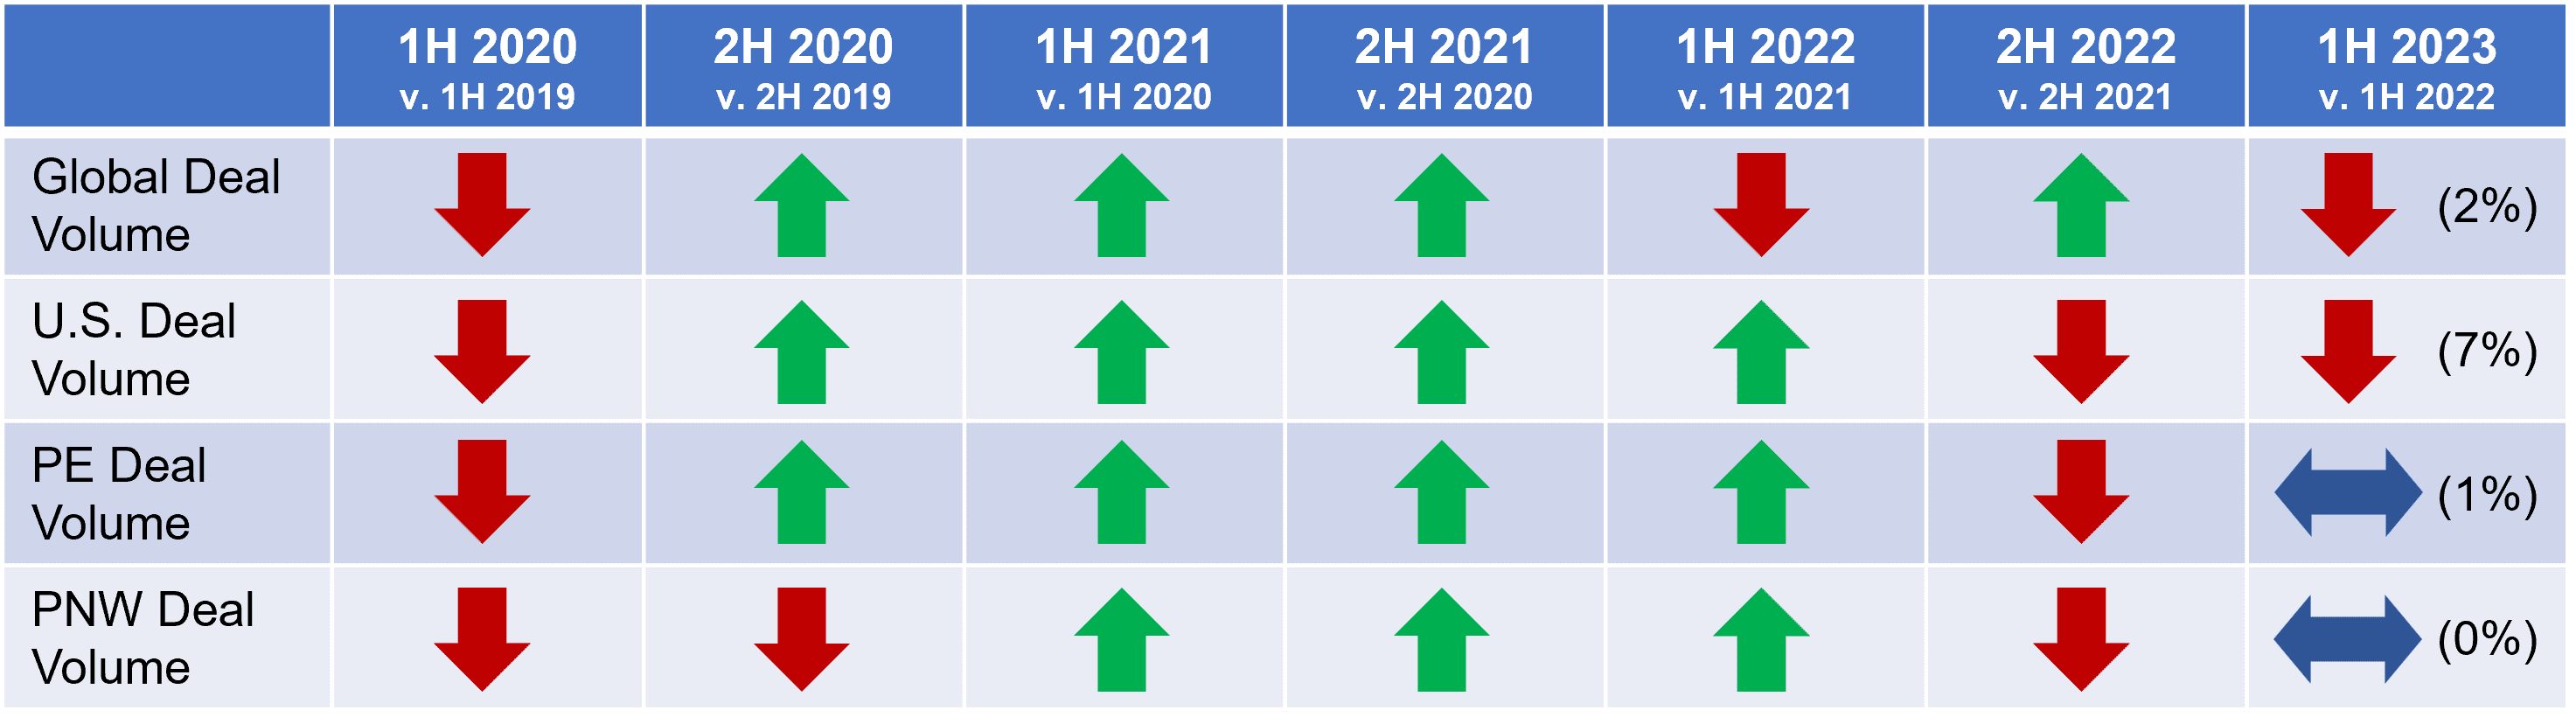
 CHINOOK M&A DASHBOARD
GLOBAL M&A ACTIVITY CONTINUES RETREAT FROM PANDEMIC-ERA IN 1H 2023
Global M&A activity diverged in 1H 2023 with high interest rates impacting deal value despite volumes remaining relatively consistent year-on-year. 1H 2023 deal volume totaled 20,599 transactions, 2% lower than the 20,920 recorded over the same period in 2022, according to the PitchBook 1H 2023 Annual Global M&A Report. Deal volume in the twelve months ended June 2023 remains almost 11% higher than pre-COVID levels when 30,530 transactions were closed annually on average from 2016-2019.
Deal values continued their decline during the 1H 2023 with a 29% decrease in the first half of 2023 to $1.8 trillion compared to $2.5 trillion in 1H 2022. Burdensome borrowing costs and diminished access to credit have led to smaller deals and fewer large transactions.
Global M&A deal multiples have fallen 16% since 2021 median EV/EBITDA multiple of 10.5x, with the last twelve months ended Q2 2023 median standing at 8.8x. Record levels of dry powder and corporate cash reserves necessitate dealmaking, albeit at reduced valuations. Impacts on global deal activity include banking instability, rapidly rising interest rates, inflation, supply chain challenges, and geopolitical conflicts.
Global M&A Activity (2014-2023)
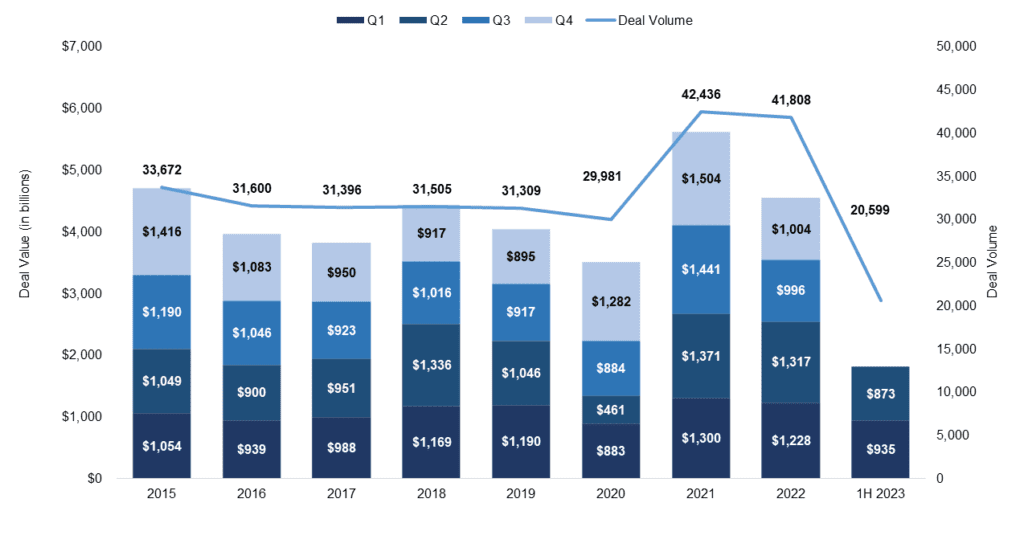 Source: Pitchbook Q2 2023 Global M&A Report
U.S. M&A ACTIVITY DECLINES IN 1H 2023
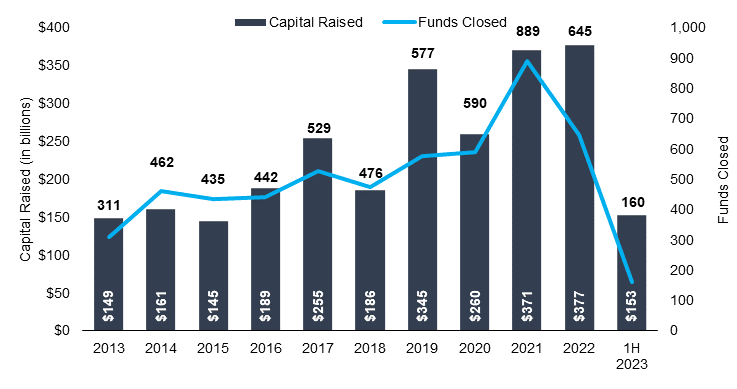
1H 2023 U.S. M&A deal volume decreased 7% to 8,752 transactions compared to 9,444 in the same period last year, according to PitchBook. U.S. M&A deal value was $960 billion in 1H 2023, 28% lower than $1.3 trillion in 1H 2022. Despite the year-over-year decline, 1H 2023 deal value was in-line with the pre-pandemic average 1H deal value from 2010-2019.
The U.S. economy demonstrated remarkable strength in the 1H 2023 relative to its peers despite worldwide challenges. Inflation moderated with the June 2023 Consumer Price Index cooling to a 2.7% year-over-year increase. The U.S. has experienced the strongest recovery in the G7 since the pandemic. Monthly job gains beat estimates on multiple occasions during the 1H 2023 and the unemployment rate remained below 4%. In a considerable shift, the Federal Reserve is no longer forecasting a recession due to the aforementioned resilience of the economy.
U.S. M&A Activity (2013-2023)
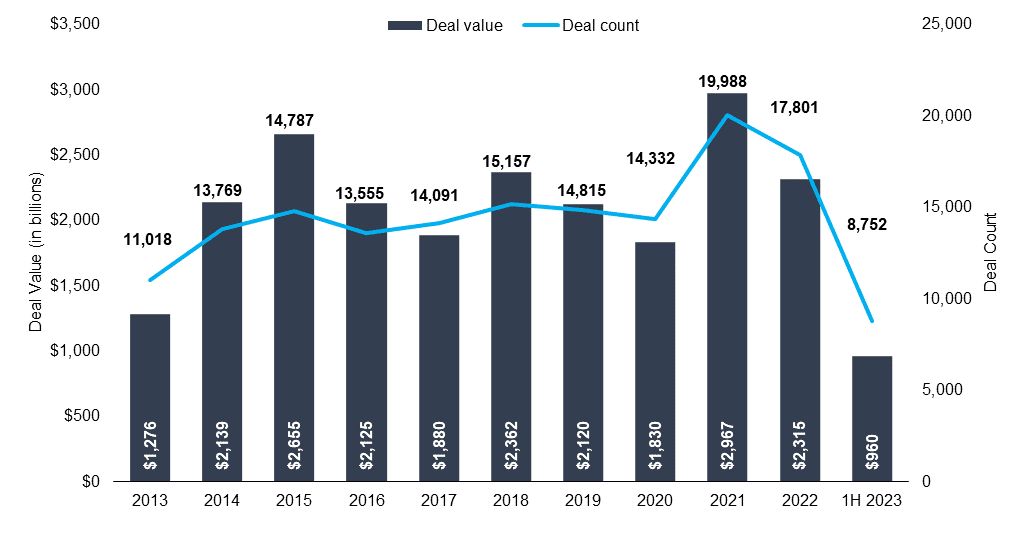
Source: PitchBook Q2 2023 Global M&A Report
U.S. PRIVATE EQUITY BEGINS 2023 WITH A SHARP DECREASE IN DEAL VALUE
U.S. private equity deal volume remained consistent, only decreasing 1% during 1H 2023 to 4,338 transactions compared to 4,390 in 1H 2022. In addition, deal value fell 30% to $418 billion compared to $594 billion in 1H 2022.
Since Q1 2021, quarterly deal volumes are down 24% and values are down 49%. Deal count has stayed strong compared to pre-pandemic figures, 56% higher than the annual average from 2016-2019, but deal value is only slightly ahead of the same period. In 1H 2023, expensive deal financing forced private equity firms to search for smaller deals with the median deal size remaining in line with 2022 at $50 million in 1H 2023 declining from a record-high $70 million in 2021. PE firms focused efforts on add-on acquisitions, which represented 78% of all buyouts in 1H 2023, to grow the size of their platform investments.
U.S. PE Deal Activity (2013-2023)
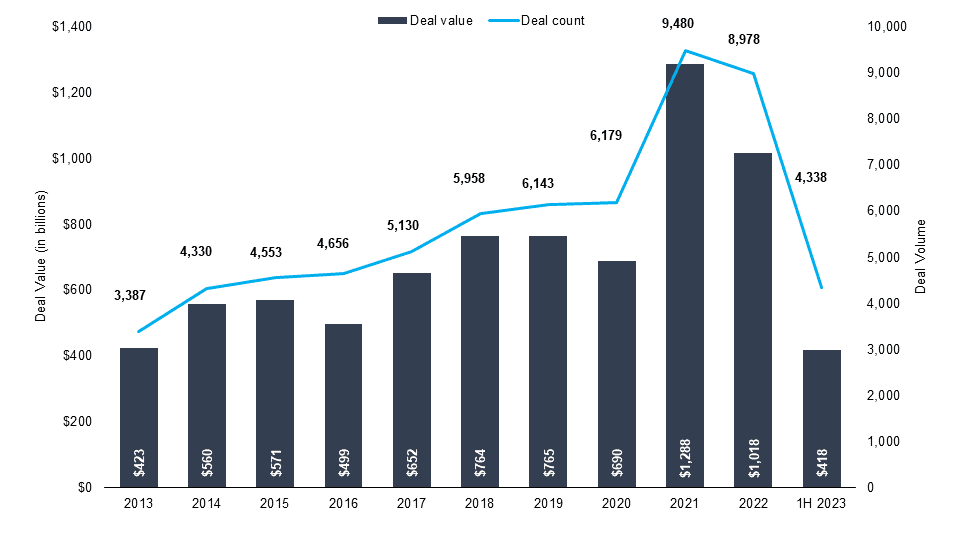
Source: PitchBook Q2 2023 US PE Breakdown
U.S. PRIVATE EQUITY FUNDRAISING MOMENTUM SLOWS
During the first half of 2023, private equity firms raised $153 billion, 13% lower compared to the $176 billion raised during the same period last year.
Notably, middle market private equity firms, which raise funds between $100 million and $5 billion, accounted for greater than 57% of funds raised in 1H 2023, raising nearly $88 billion, putting 2023 on track to be the highest fundraising year for middle market firms since 2019. Private equity’s share of private market strategies is likely to shrink in 2023 with other alternative investments like private credit and real estate continuing to grow in popularity.
U.S. PE Annual Fundraising Activity (2013-2023)
Source: PitchBook Q2 2023 US PE Breakdown
PRIVATE EQUITY DRY POWDER IN ABUNDANCE FOR TRANSACTIONS
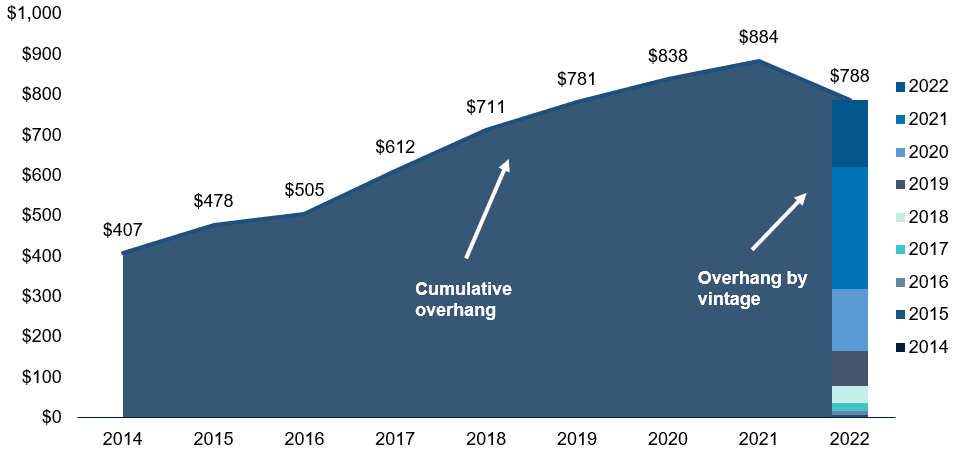
Through the first half of 2023, global cumulative dry powder rose more than 11% to a record high of nearly $2.5 trillion. An important metric for tracking private equity firms’ deployment of dry powder is the exit-to-investment ratio. In 1H 2023, the exit-to-investment ratio dropped 15% from the end of 2022 to 0.33x, a 15-year low. Due to limited exit routes resulting from a sluggish IPO market and higher financing costs, private equity firms are deploying more dry powder to bolster platform investments until a more opportune time to exit arrives.
U.S. Cumulative Dry Powder (2014-2022)
Source: PitchBook
1H 2023 PACIFIC NORTHWEST DEAL VOLUME REMAINS STRONG
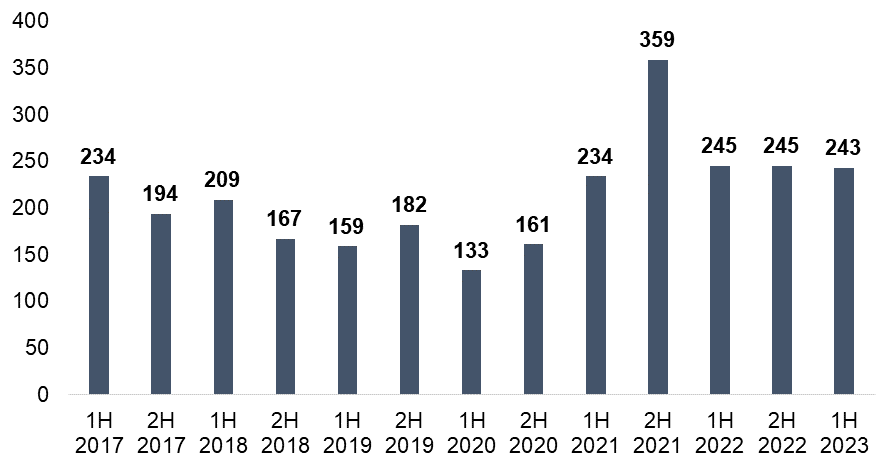
Total deal volume in the Pacific Northwest remained flat at 243 transactions in 1H 2023 compared to 245 in 1H 2022. 1H 2023 activity remains 15% above the pre-pandemic average activity of 212 deals during the first half of the year.
Pacific Northwest Deal Volume (2017-2023)
Source: PitchBook
BUSINESS SERVICES AND TECHNOLOGY DEALS LEAD PACIFIC NORTHWEST REGION
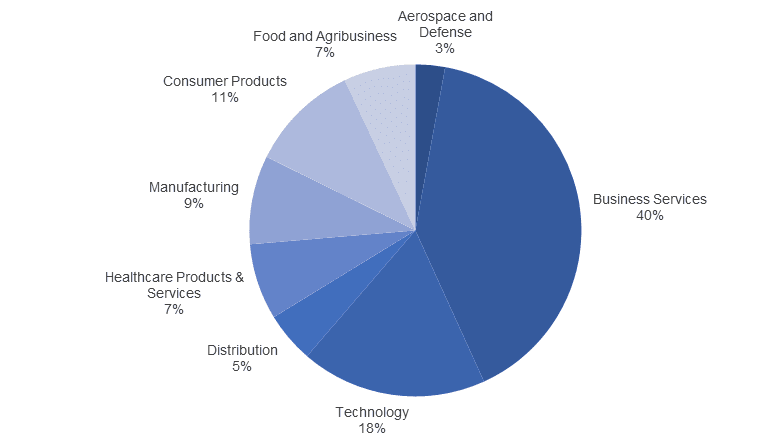
Business Services and Technology transactions led Pacific Northwest M&A activity during the first half of 2023, consistent with previous periods. Distribution decreased from 13% of deals in 2H 2022 to 5% in 1H 2023, the highest percentage decrease of any industry during this period. Technology increased from 16% of deals in 1H 2023 to 19% in 1H 2023, which is slightly below the industry average during prior periods.
1H 2023 Pacific Northwest Deal Activity by Industry
Source: PitchBook
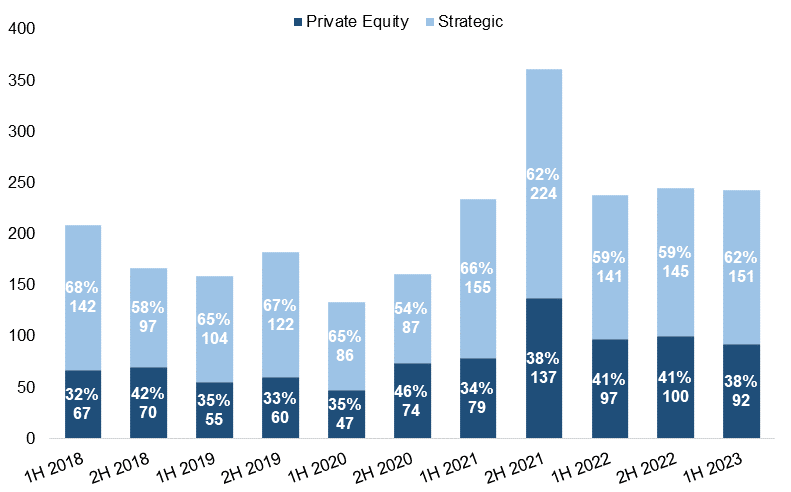
PRIVATE EQUITY INVESTORS REPRESENT A LARGE SHARE OF PNW DEALS
From 1H 2019 to 1H 2023, private equity transactions made up nearly 38% of deal activity in the Pacific Northwest. Private equity investors’ share of transactions in 1H 2023 was in line with historical averages, representing 38% of transactions while strategic acquisitions represented 62%.
Pacific Northwest Deal Activity by Investor (2018-2023)
Source: PitchBook
SELECT 1H 2023 PACIFIC NORTHWEST M&A TRANSACTIONS
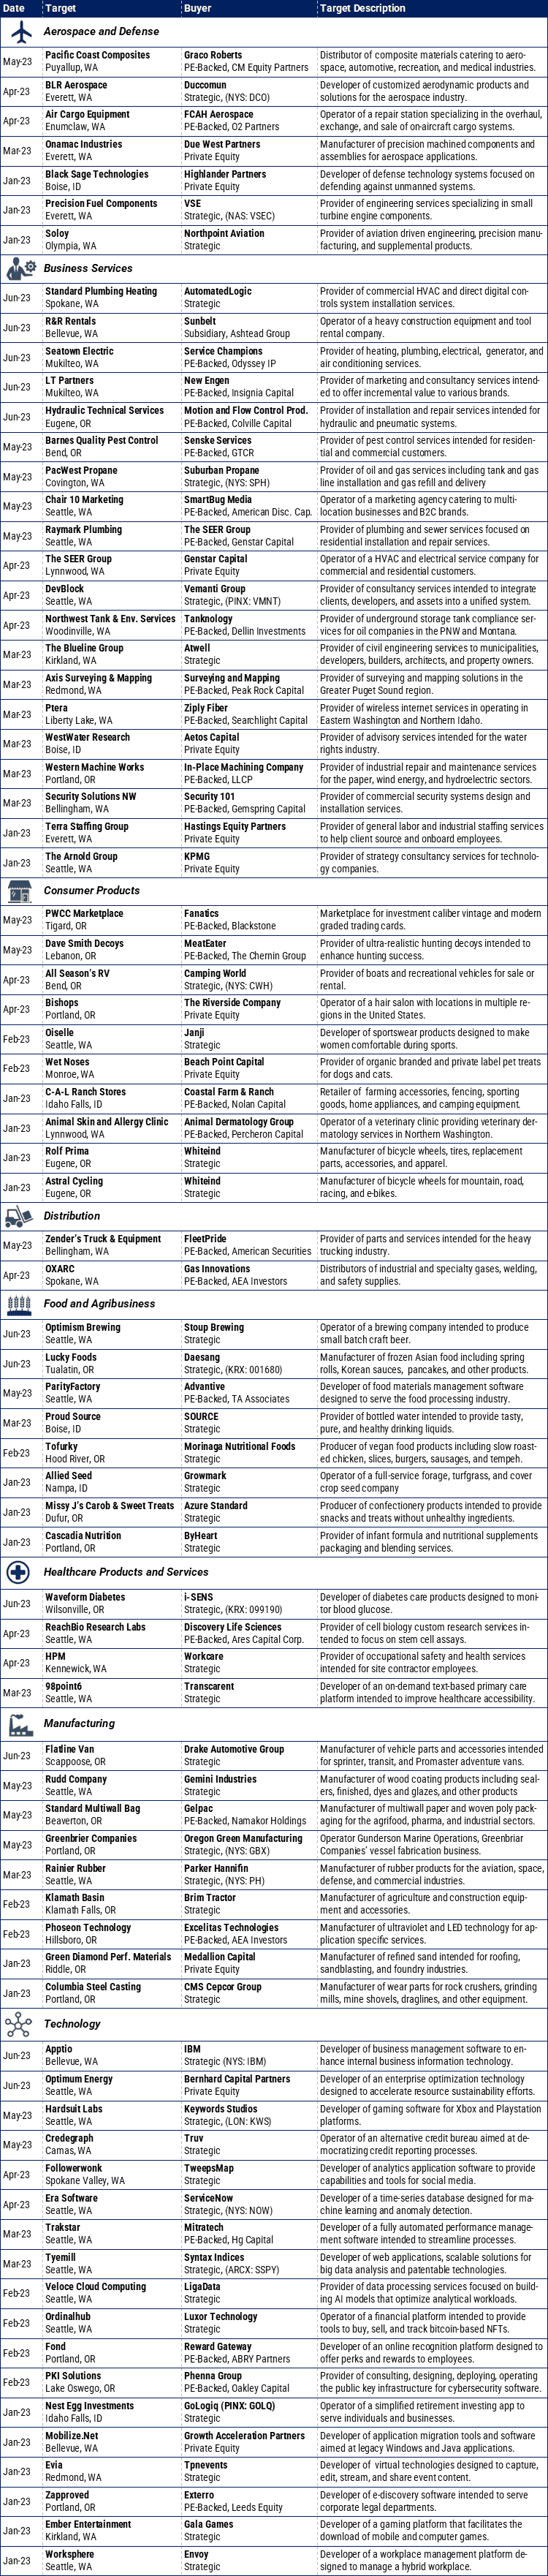
Sources: PitchBook, Portland Business Journal, Puget Sound Business Journal