The Chinook Report: 2H 2022
The latest bi-annual report of M&A activity, focusing on global, national, and regional (Pacific Northwest) trends. Includes profiles of transactions generally with an Enterprise Value (EV) between $10 and $100 million.
Click here to download a copy of this report.
 CHINOOK M&A DASHBOARD
GLOBAL M&A DEAL MOMENTUM SHOWS MIXED
RESULTS IN 2H 2022
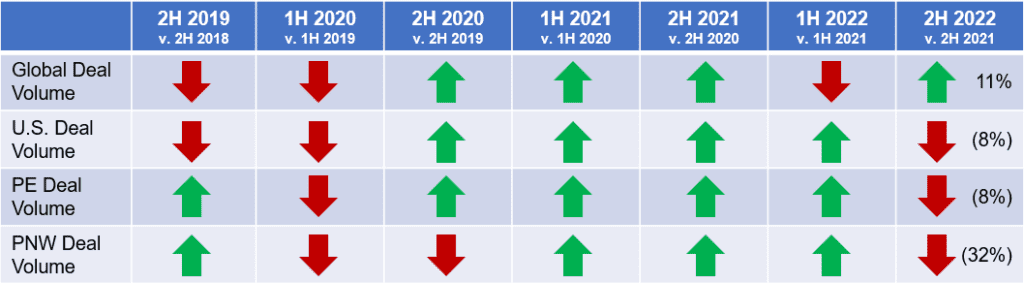
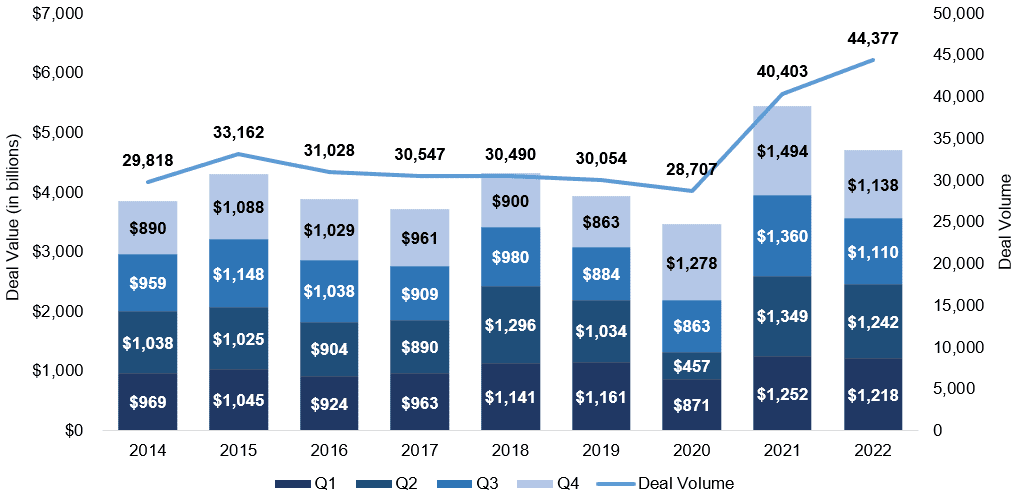
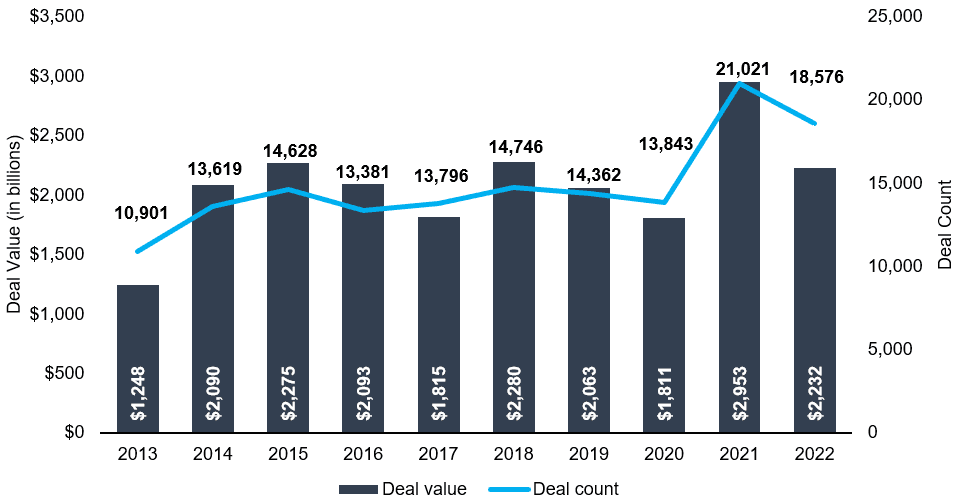
Despite persistent inflation and rapidly rising interest rates, global deal volume grew in 2022. 2H 2022 deal volume totaled 23,159 transactions, 11% higher than the 20,891 recorded over the same period in 2021. There were 44,377 transactions recorded in 2022, 10% higher than the 40,403 recorded in 2021 according to the PitchBook 2022 Annual Global M&A Report. Annual deal volume remains 45% higher than pre-COVID levels when 30,530 transactions were closed on average from 2016-2019.
Despite a rise in M&A volumes, deal value declined year on year. Global deal value decreased 14% in 2022 to $4.7 trillion compared to the record-high $5.5 trillion last year. Despite the decline in value, deal value remains almost 20% higher than pre-COVID levels for the three years ending in 2019.
Deal activity in 2022 was a tale of two halves. 1H 2022 was reminiscent of the blockbuster deal activity of 2021. In March, momentum shifted when the Federal Reserve hiked interest rates for the first time since December 2018, and raised rates six more times in 2022. The federal funds rates in Dec-22 is 4.25-4.50%, up from 0-0.25% in Dec-21. Other impacts on global deal activity include supply chain challenges, inflation in response to the geopolitical crises, the war in Ukraine, and labor shortages.
Global M&A Activity (2014-2022)
Source: Pitchbook 2022 Global M&A Report
U.S. M&A ACTIVITY DECLINES IN 2H 2022
2H 2022 U.S. M&A deal volume decreased 8% to 9,399 transactions compared to 10,271 in the same period last year, according to PitchBook. U.S. M&A deal value was $2.2 trillion in 2022, 22% lower than $2.9 trillion in 2021. Despite the year-over-year decline, 2H 2022 deal value was in-line with the average 2H deal value from 2010-2021.
The U.S. economy remained strong in 2022 relative to its peers despite numerous challenges including persistent inflation, global conflicts, and contractionary monetary policy. The Consumer Price Index rose 6.5% in 2022 and consumer spending grew 2.1%. Unemployment hit a 53-year low in January, beating all estimates. Positive economic data complicate the Federal Reserve’s plan to slow inflationary pressures, which could push the Federal Reserve to raise interest rates higher than previously expected.
U.S. M&A Activity (2008-2022)
Source: PitchBook 2022 Global M&A Report
U.S. PRIVATE EQUITY ENDS 2022 WITH A SHARP DECREASE IN DEAL ACTIVITY
U.S. private equity deal volume decreased 2% during 2022 to 8,897 transactions compared to 9,120 last year. In addition, deal value fell 20% to $1 trillion compared to $1.2 trillion in 2021. 2H 2022 deal volume fell by 8% compared to 2H 2021 and deal value shrunk by 31% during the same period.
Private equity remains active in the U.S. market despite headwinds to M&A. In Q4 2022, deal value declined 36% from the same period last year to $234 billion. Although if this quarterly pace continues in 2023, deal value would still be 31% above the pre-pandemic levels. In 2H 2022, expensive deal financing forced private equity firms to search for smaller deals with the median deal size declining to $50 million in 2022 from a record-high $70 million in 2021. In 2022, tailwinds to M&A activity were the abundance of dry powder, which remains at historically elevated levels, and the desire to complete add-on acquisitions to grow the size of their platform investments. The annual deal count is still higher than every year except in 2001.
U.S. PE Deal Activity (2008-2022)
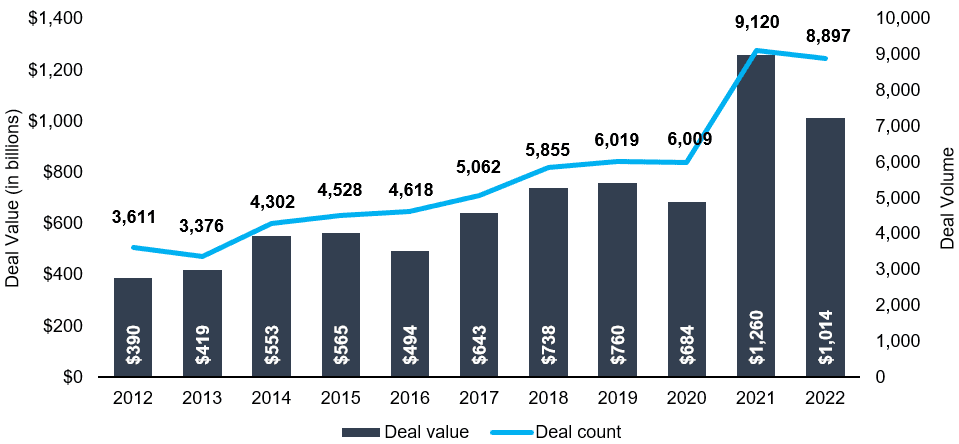
Source: PitchBook 2022 US PE Breakdown
U.S. PRIVATE EQUITY FUNDRAISING REACHES SECOND-HIGHEST ANNUAL AMOUNT ON RECORD
During the second half of 2022, private equity firms raised $167 billion, 37% higher compared to the $122 billion raised during the same period last year. Total fundraising for 2022 reached $343 billion, the second-highest amount on record. An increasing portion were for large private equity funds, $3 billion or greater. These large funds made up 53% by value of total funds raised in 2022, an increase from 43% in 2021.
Although fundraising in 2022 was strong, 2023 may prove to be challenging due to the denominator effect. This happens as a result of the slow-to-adjust valuations in private equity, leading to an over allocation when compared to falling returns in the public markets.
U.S. PE Annual Fundraising Activity (2008-2022)
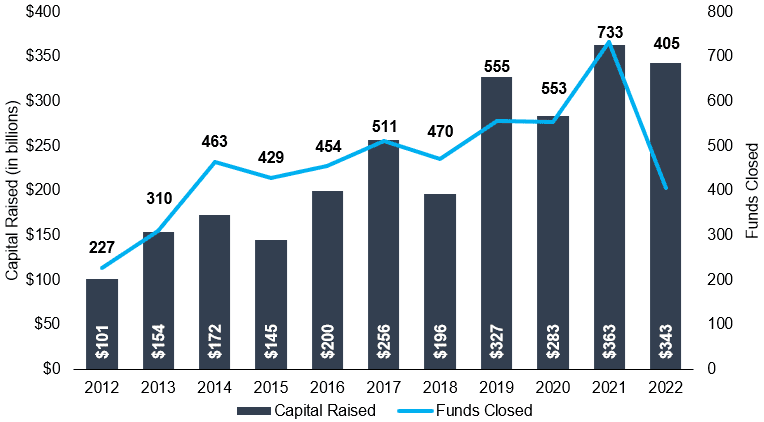
Source: PitchBook 2022 US PE Breakdown
PRIVATE EQUITY DRY POWDER IN ABUNDANCE FOR TRANSACTIONS
Through the second half of 2022, cumulative dry powder in the United States remained relatively steady at nearly $790 billion. Nearly 60% of this was raised in 2021 and 2022. Due to rising borrowing costs, private equity funds will use less leverage to finance an acquisition, but with near-record amounts of dry powder for acquisitions, the push for these funds to find portfolio companies and add-ons continues.
U.S. Cumulative Dry Powder (2008-2022)
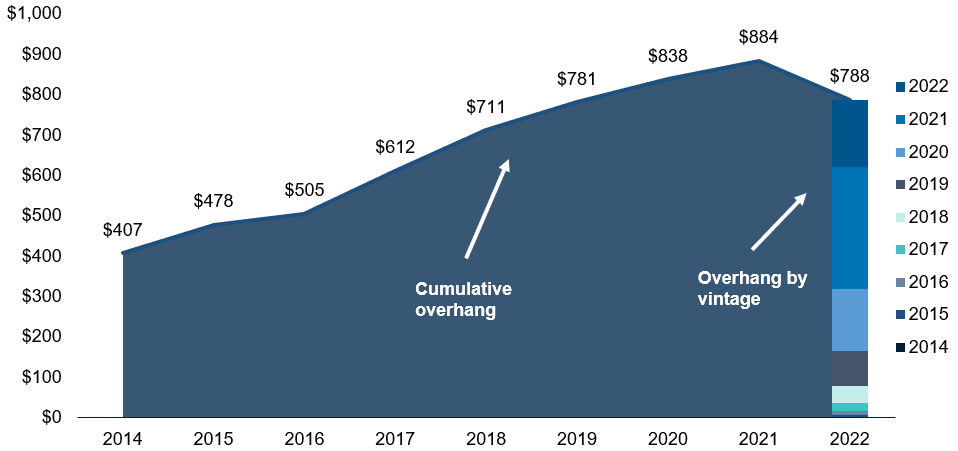
Source: PitchBook
LOWER-MIDDLE MARKET EBITDA MULTIPLES PAID BY PRIVATE EQUITY JUMP TO FIVE-YEAR HIGH
According to GF Data, average EBITDA multiples paid in 2022 by private equity groups for companies with an enterprise value between $10-25 million increased to 6.5x, a record high. However, by Q4 2022, EBITDA multiples retreated to 6.1x, bringing valuations in line with prior periods. Impacts on valuation include macroeconomic uncertainty, lower debt coverage, and increased interest rates.
EBITDA Multiples
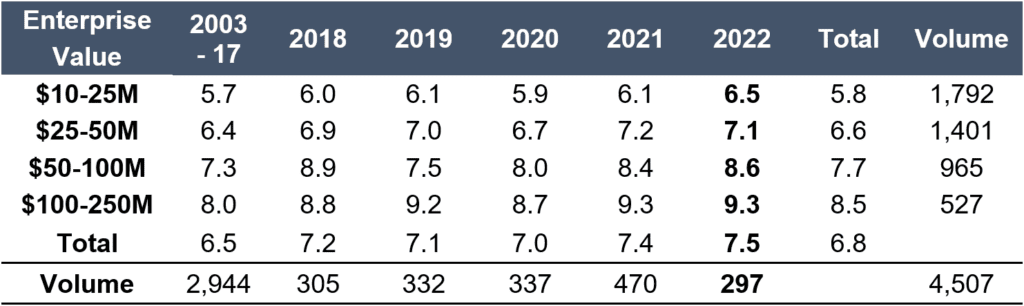
Source: GF Data M&A Report 2022
2H 2022 PACIFIC NORTHWEST DEAL VOLUME REMAINS ELEVATED ON A HISTORICAL BASIS
Total deal volume in the Pacific Northwest decreased 32% to 245 transactions in 2H 2022 compared to 359 in 2H 2021. 2H 2022 activity remains 32% above the pre-pandemic average activity of 186 deals during the second half of the year.
Pacific Northwest Deal Volume
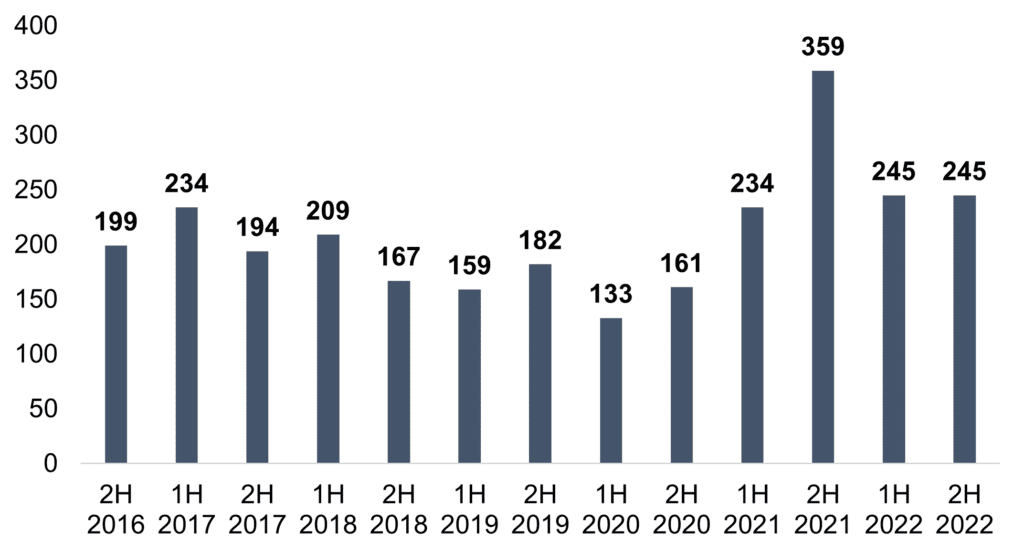
Source: PitchBook
BUSINESS SERVICES AND TECHNOLOGY DEALS LEAD PACIFIC NORTHWEST REGION
Business Services and Technology transactions led Pacific Northwest M&A activity during the first half of 2022, consistent with previous periods. Distribution increased from 2% of deals in 1H 2022 to 13% in 2H 2022, the highest percentage increase of any industry during this period. Consumer Products & Retail declined from 17% of deals in 1H 2022 to 8% in 2H 2022, which is in line with the industry average during prior periods.
2H 2022 Pacific Northwest Deal Activity by Industry
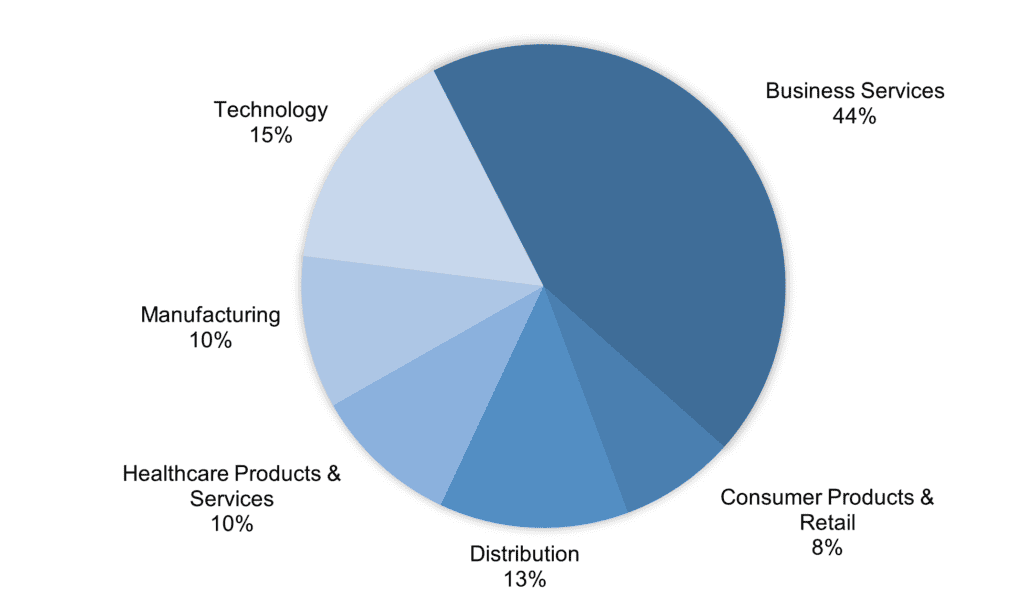
Source: PitchBook
PRIVATE EQUITY INVESTORS REPRESENT A LARGE SHARE OF PNW DEALS
From 2H 2018 to 2H 2022, private equity transactions made up nearly 40% of deal activity in the Pacific Northwest. Private equity investors’ share of transactions in 2H 2022 represented 41% of transactions while strategic acquisitions represented 59%.
Pacific Northwest Deal Activity by Investor
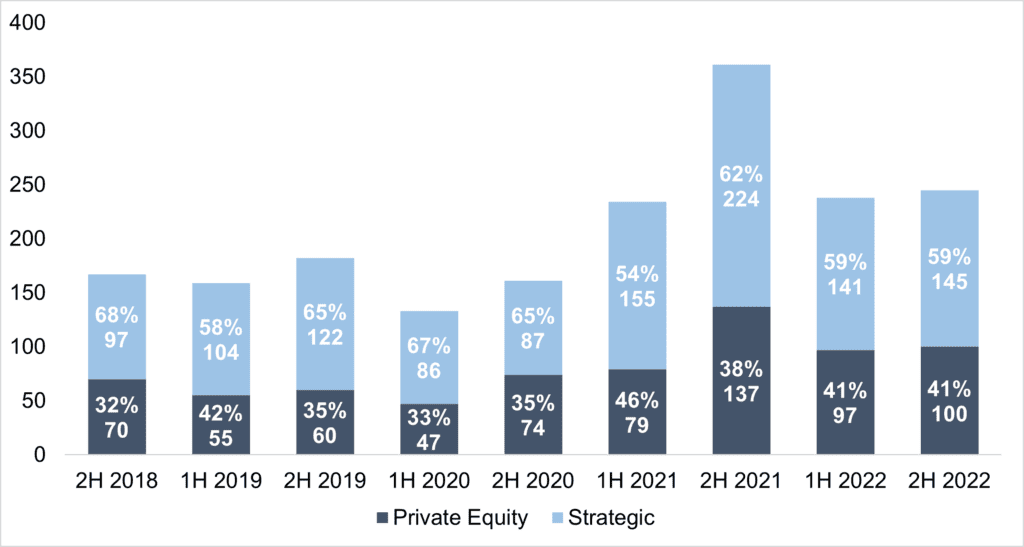
Source: PitchBook
SELECT 2H 2022 PACIFIC NORTHWEST M&A TRANSACTIONS
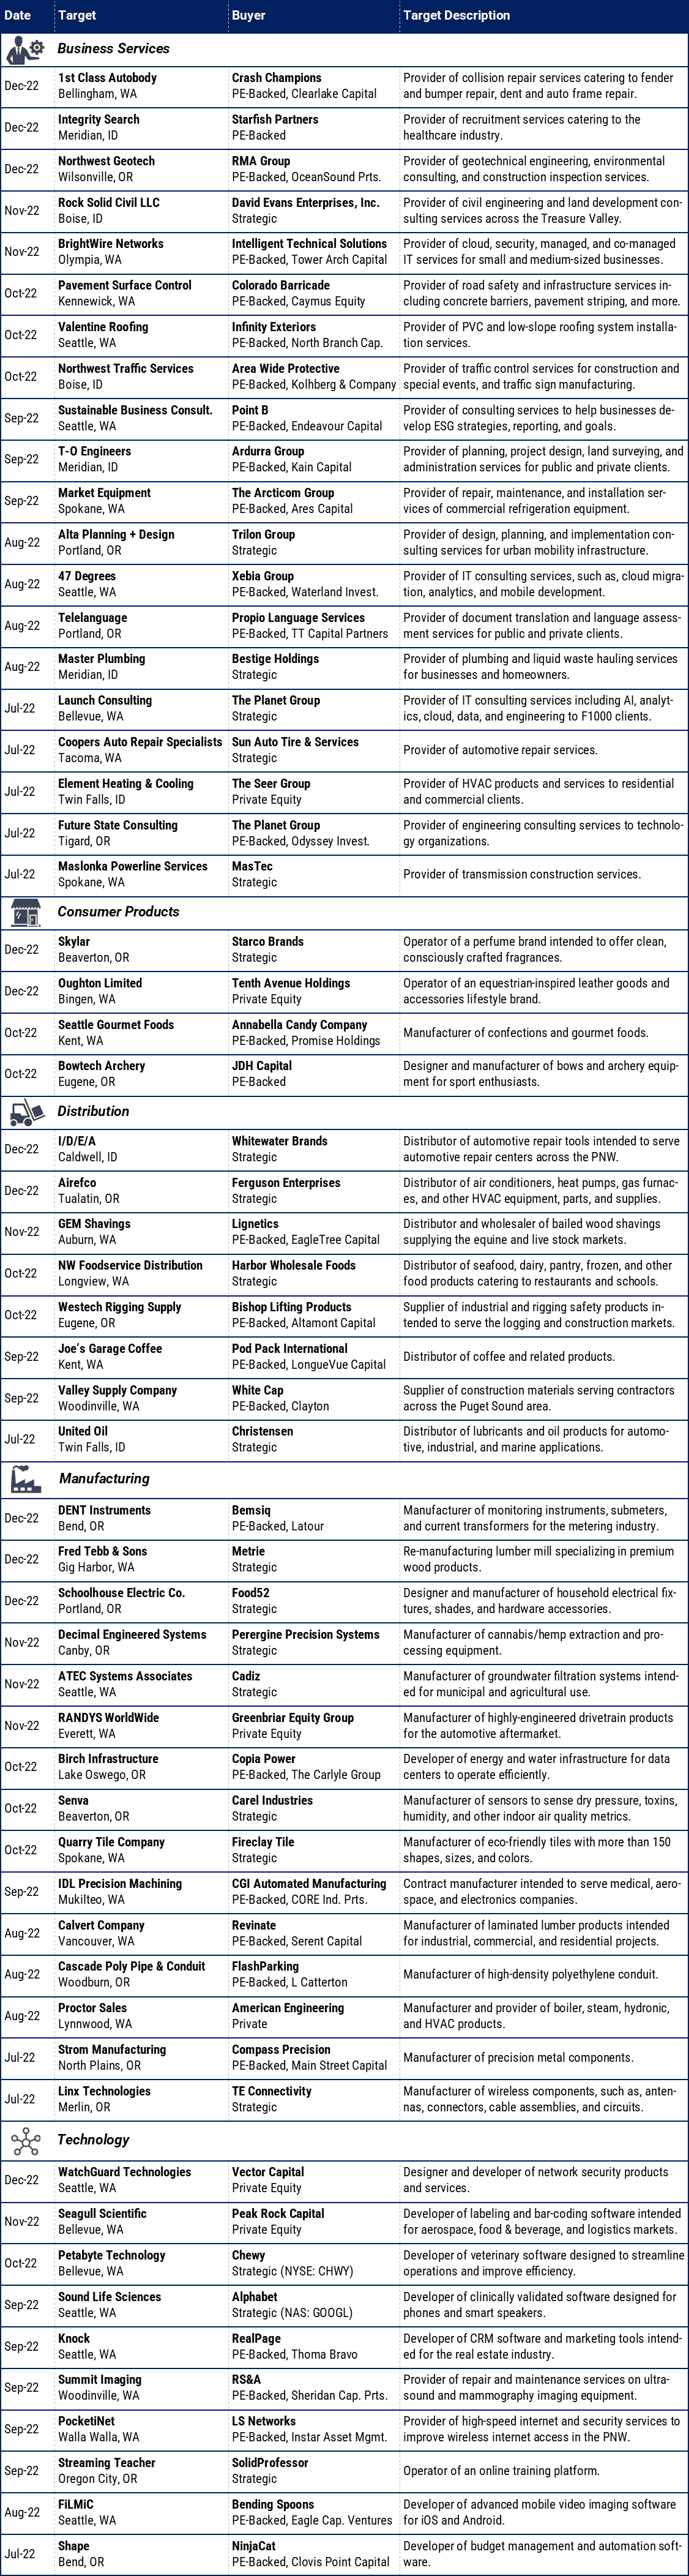
Sources: PitchBook, Portland Business Journal, Puget Sound Business Journal

The latest bi-annual report of M&A activity, focusing on global, national, and regional (Pacific Northwest) trends. Includes profiles of transactions generally with an Enterprise Value (EV) between $10 and $100 million.
GLOBAL M&A DEAL MOMENTUM SHOWS MIXED
RESULTS IN 2H 2022
Despite persistent inflation and rapidly rising interest rates, global deal volume grew in 2022. 2H 2022 deal volume totaled 23,159 transactions, 11% higher than the 20,891 recorded over the same period in 2021. There were 44,377 transactions recorded in 2022, 10% higher than the 40,403 recorded in 2021 according to the PitchBook 2022 Annual Global M&A Report. Annual deal volume remains 45% higher than pre-COVID levels when 30,530 transactions were closed on average from 2016-2019.
Despite a rise in M&A volumes, deal value declined year on year. Global deal value decreased 14% in 2022 to $4.7 trillion compared to the record-high $5.5 trillion last year. Despite the decline in value, deal value remains almost 20% higher than pre-COVID levels for the three years ending in 2019.
Deal activity in 2022 was a tale of two halves. 1H 2022 was reminiscent of the blockbuster deal activity of 2021. In March, momentum shifted when the Federal Reserve hiked interest rates for the first time since December 2018, and raised rates six more times in 2022. The federal funds rates in Dec-22 is 4.25-4.50%, up from 0-0.25% in Dec-21. Other impacts on global deal activity include supply chain challenges, inflation in response to the geopolitical crises, the war in Ukraine, and labor shortages.
Global M&A Activity (2014-2022)
Source: Pitchbook 2022 Global M&A Report

U.S. M&A ACTIVITY DECLINES IN 2H 2022
2H 2022 U.S. M&A deal volume decreased 8% to 9,399 transactions compared to 10,271 in the same period last year, according to PitchBook. U.S. M&A deal value was $2.2 trillion in 2022, 22% lower than $2.9 trillion in 2021. Despite the year-over-year decline, 2H 2022 deal value was in-line with the average 2H deal value from 2010-2021.
The U.S. economy remained strong in 2022 relative to its peers despite numerous challenges including persistent inflation, global conflicts, and contractionary monetary policy. The Consumer Price Index rose 6.5% in 2022 and consumer spending grew 2.1%. Unemployment hit a 53-year low in January, beating all estimates. Positive economic data complicate the Federal Reserve’s plan to slow inflationary pressures, which could push the Federal Reserve to raise interest rates higher than previously expected.
U.S. M&A Activity (2008-2022)
Source: PitchBook 2022 Global M&A Report

U.S. PRIVATE EQUITY ENDS 2022 WITH A SHARP DECREASE IN DEAL ACTIVITY
U.S. private equity deal volume decreased 2% during 2022 to 8,897 transactions compared to 9,120 last year. In addition, deal value fell 20% to $1 trillion compared to $1.2 trillion in 2021. 2H 2022 deal volume fell by 8% compared to 2H 2021 and deal value shrunk by 31% during the same period.
Private equity remains active in the U.S. market despite headwinds to M&A. In Q4 2022, deal value declined 36% from the same period last year to $234 billion. Although if this quarterly pace continues in 2023, deal value would still be 31% above the pre-pandemic levels. In 2H 2022, expensive deal financing forced private equity firms to search for smaller deals with the median deal size declining to $50 million in 2022 from a record-high $70 million in 2021. In 2022, tailwinds to M&A activity were the abundance of dry powder, which remains at historically elevated levels, and the desire to complete add-on acquisitions to grow the size of their platform investments. The annual deal count is still higher than every year except in 2001.
U.S. PE Deal Activity (2008-2022)
Source: PitchBook 2022 US PE Breakdown
U.S. PRIVATE EQUITY FUNDRAISING REACHES SECOND-HIGHEST ANNUAL AMOUNT ON RECORD
During the second half of 2022, private equity firms raised $167 billion, 37% higher compared to the $122 billion raised during the same period last year. Total fundraising for 2022 reached $343 billion, the second-highest amount on record. An increasing portion were for large private equity funds, $3 billion or greater. These large funds made up 53% by value of total funds raised in 2022, an increase from 43% in 2021.
Although fundraising in 2022 was strong, 2023 may prove to be challenging due to the denominator effect. This happens as a result of the slow-to-adjust valuations in private equity, leading to an over allocation when compared to falling returns in the public markets.
U.S. PE Annual Fundraising Activity (2008-2022)
Source: PitchBook 2022 US PE Breakdown

PRIVATE EQUITY DRY POWDER IN ABUNDANCE FOR TRANSACTIONS
Through the second half of 2022, cumulative dry powder in the United States remained relatively steady at nearly $790 billion. Nearly 60% of this was raised in 2021 and 2022. Due to rising borrowing costs, private equity funds will use less leverage to finance an acquisition, but with near-record amounts of dry powder for acquisitions, the push for these funds to find portfolio companies and add-ons continues.
U.S. Cumulative Dry Powder (2008-2022)
Source: PitchBook

LOWER-MIDDLE MARKET EBITDA MULTIPLES PAID BY PRIVATE EQUITY JUMP TO FIVE-YEAR HIGH
According to GF Data, average EBITDA multiples paid in 2022 by private equity groups for companies with an enterprise value between $10-25 million increased to 6.5x, a record high. However, by Q4 2022, EBITDA multiples retreated to 6.1x, bringing valuations in line with prior periods. Impacts on valuation include macroeconomic uncertainty, lower debt coverage, and increased interest rates.
EBITDA Multiples
Source: GF Data M&A Report 2022

2H 2022 PACIFIC NORTHWEST DEAL VOLUME REMAINS ELEVATED ON A HISTORICAL BASIS
Total deal volume in the Pacific Northwest decreased 32% to 245 transactions in 2H 2022 compared to 359 in 2H 2021. 2H 2022 activity remains 32% above the pre-pandemic average activity of 186 deals during the second half of the year.
Pacific Northwest Deal Volume
Source: PitchBook
BUSINESS SERVICES AND TECHNOLOGY DEALS LEAD PACIFIC NORTHWEST REGION
Business Services and Technology transactions led Pacific Northwest M&A activity during the first half of 2022, consistent with previous periods. Distribution increased from 2% of deals in 1H 2022 to 13% in 2H 2022, the highest percentage increase of any industry during this period. Consumer Products & Retail declined from 17% of deals in 1H 2022 to 8% in 2H 2022, which is in line with the industry average during prior periods.
2H 2022 Pacific Northwest Deal Activity by Industry
Source: PitchBook
PRIVATE EQUITY INVESTORS REPRESENT A LARGE SHARE OF PNW DEALS
From 2H 2018 to 2H 2022, private equity transactions made up nearly 40% of deal activity in the Pacific Northwest. Private equity investors’ share of transactions in 2H 2022 represented 41% of transactions while strategic acquisitions represented 59%.
Pacific Northwest Deal Activity by Investor
Source: PitchBook

SELECT 2H 2022 PACIFIC NORTHWEST M&A TRANSACTIONS
Sources: PitchBook, Portland Business Journal, Puget Sound Business Journal