The Chinook Report: 1H 2022
The latest bi-annual report of M&A activity, focusing on global, national, and regional (Pacific Northwest) trends. Includes profiles of transactions generally with an Enterprise Value (EV) between $10 and $100 million.
Click here to download a copy of this report.
 CHINOOK M&A DASHBOARD
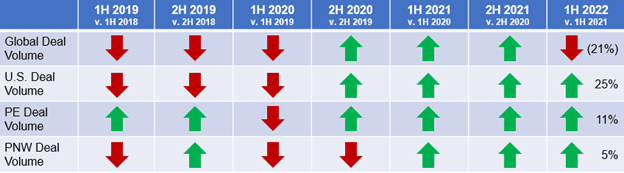
GLOBAL M&A DEAL ACTIVITY SHRUNK IN 1H 2022
For the first time since 2020, global deal volume shrunk. There were 14,396 transactions recorded in 1H 2022, 21% lower than the 18,175 recorded in 1H 2021 according to the PitchBook 2022 Q2 Global M&A Report. Deal volume was 24% lower than the second half of 2021 when 18,994 transactions were closed.
Deal value followed a similar path. Global deal value decreased 12% in 1H 2022 to $1.97 trillion compared to $2.25 trillion in 1H 2021. Additionally, deal value decreased 28% compared to the second half of 2021, when $2.74 trillion of value was recorded.
M&A activity remains in-line with previous years, despite the record-breaking 2021 period. Even with the ease in travel restrictions and the global supply chain, economic uncertainty, and inflation remain in the forefront of dealmakers. In addition, the war in Ukraine and tensions between Taiwan and China have added pressure on commodities.
Global M&A Activity (2014-2022)
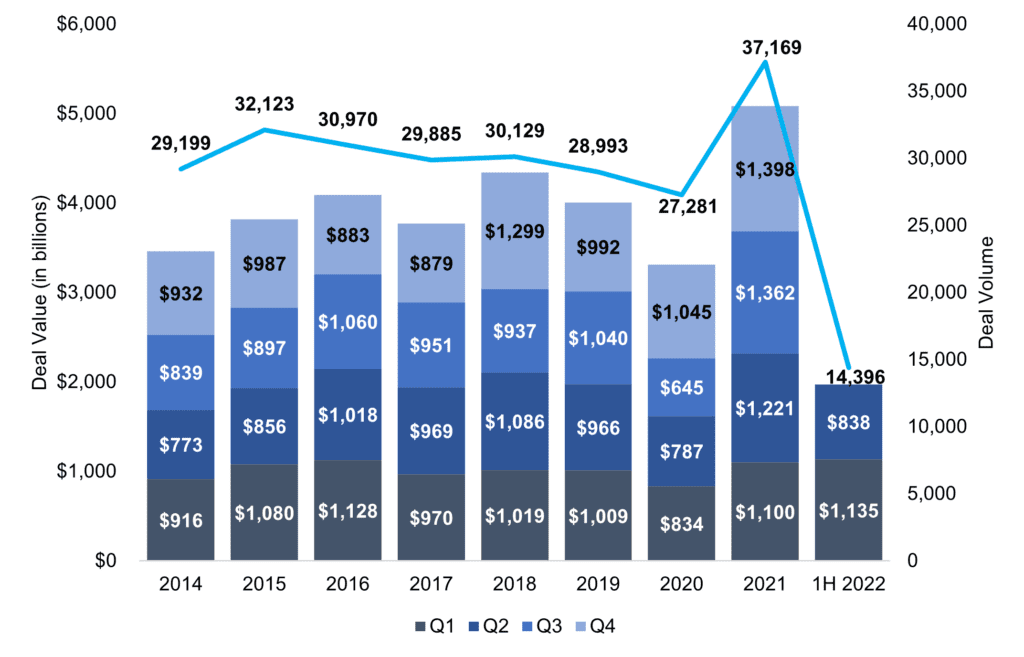
Source: Pitchbook Q2 2022 Global M&A Report
U.S. M&A ACTIVITY INCREASES IN 1H 2022, CONTRARY TO GLOBAL TRENDS
1H 2022 U.S. M&A deal volume increased 25% to 10,316 transactions compared to 8,266 in the same period last year, according to PitchBook. U.S. M&A deal value was $1.22 trillion during the first half of 2022, 6% higher than $1.14 trillion in 1H 2021. 2022 recorded the highest first half in total deal value for nine years.
U.S. inflation rates remain at record levels. The Consumer Price Index rose 9% in June, the largest increase in nearly 40 years. To slow inflationary pressures, the Federal Reserve has pursued an agenda of raising interest rates. Further rate hikes risk affecting future M&A activity.
U.S. M&A Activity (2008-2022)
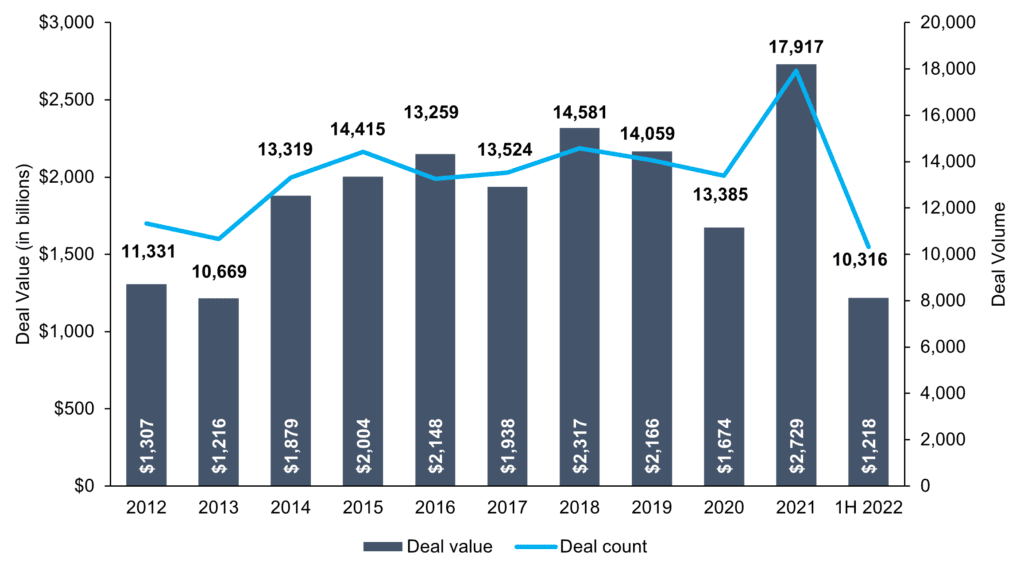
Source: PitchBook Q2 2022 Global M&A Report
U.S. PRIVATE EQUITY ACTIVITY GROWS IN 1H 2022
In line with U.S. M&A trends, U.S. private equity deal volume increased 11% during 1H 2022 to 4,337 transactions compared to the same period last year. In addition, deal value increased 6% to $529 billion compared to $497 billion in 1H 2021.
Private equity remains active in the U.S. market despite headwinds to M&A. Rising interest rates as a response to the challenging inflationary environment has undercut the value of assets today.
U.S. PE Deal Activity (2008-2022)
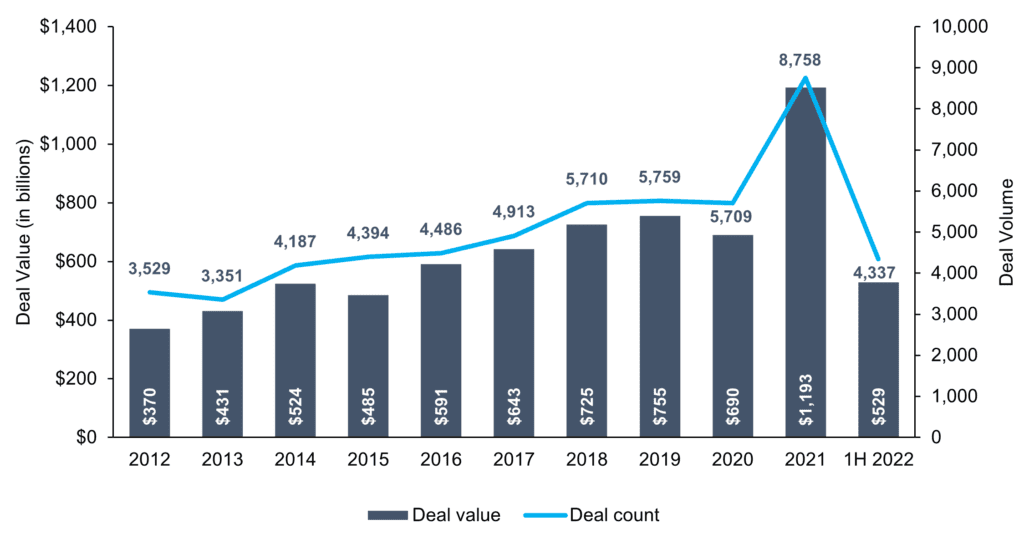
Source: PitchBook Q2 2022 US PE Breakdown
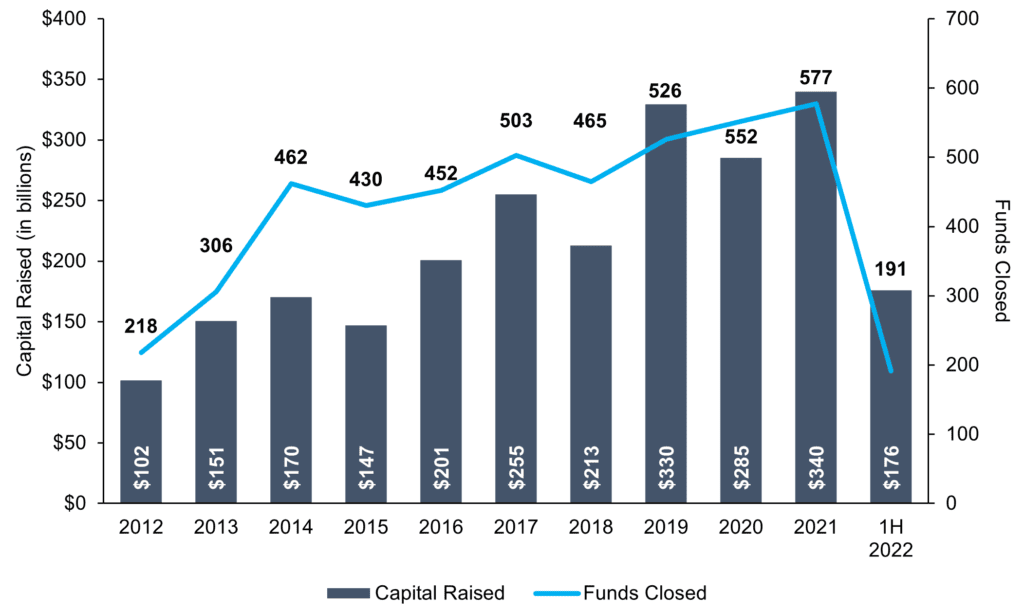
U.S. PRIVATE EQUITY FUNDRAISING ON TREND
During the first half of 2022, private equity firms raised $176 billion, 2% lower compared to $180 billion during the same period last year. Despite a drop in fundraising in 1H 2022, total fundraising for 2022 is on pace with 2021 numbers. Institutional and affluent investors continue to increase their private equity allocations as they chase stellar returns and avoid possible public market volatility.
U.S. PE Annual Fundraising Activity (2008-2022)
Source: PitchBook Q2 2022 US PE Breakdown
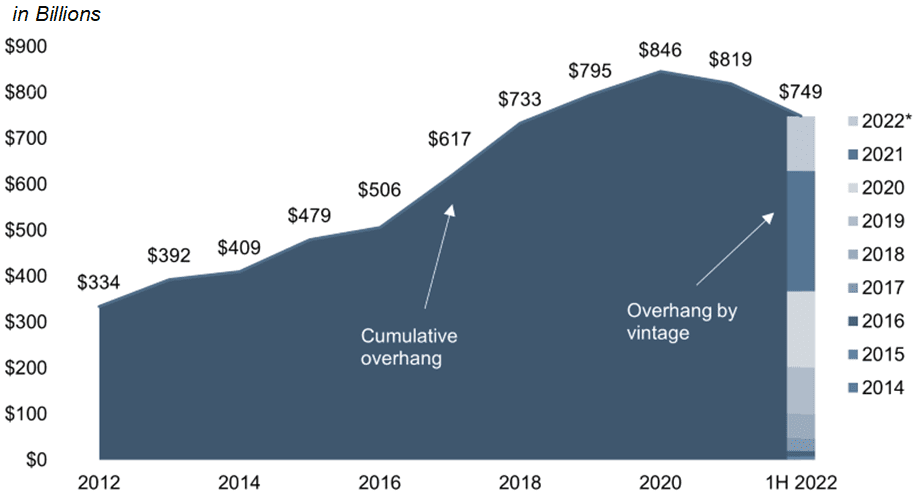
PRIVATE EQUITY DRY POWDER IN ABUNDANCE FOR TRANSACTIONS
In 1H 2022, one tailwind to M&A activity was the abundance of dry powder, which remains at historically elevated levels. With record amounts of dry powder for acquisitions, the push for private equity funds to find portfolio companies and add-ons continues. Through the first half of 2022, cumulative dry powder in the United States remained relatively steady at nearly $750 billion.
U.S. Cumulative Dry Powder (2008-2022)
Source: PitchBook
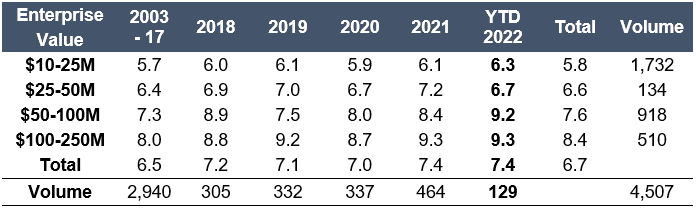
LOWER-MIDDLE MARKET EBITDA MULTIPLES PAID BY PRIVATE EQUITY JUMP TO FIVE-YEAR HIGH
Average EBITDA multiples paid in 2022 by private equity groups for companies with an enterprise value between $10-25 million increased to 6.3x, a five-year high. The increase is consistent with the rise in multiples for companies across most enterprise value intervals.
EBITDA Multiples
Source: GF Data M&A Report Spring 2022
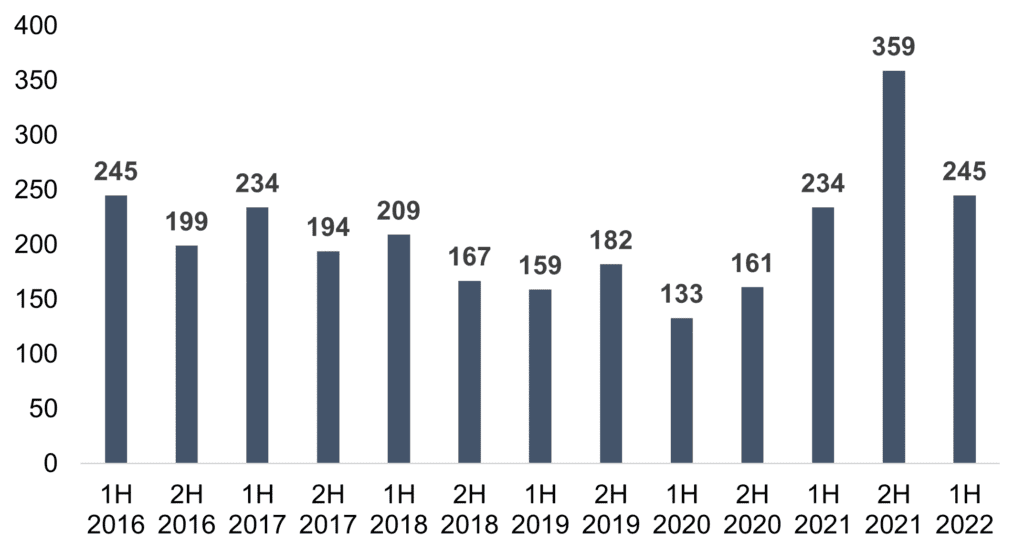
1H 2022 PACIFIC NORTHWEST DEAL VOLUME REACHES HIGHEST LEVEL IN SIX YEARS
Total deal volume in the Pacific Northwest increased 5% to 245 transactions in 1H 2022 compared to 234 in 1H 2021.
Pacific Northwest Deal Volume
Source: PitchBook
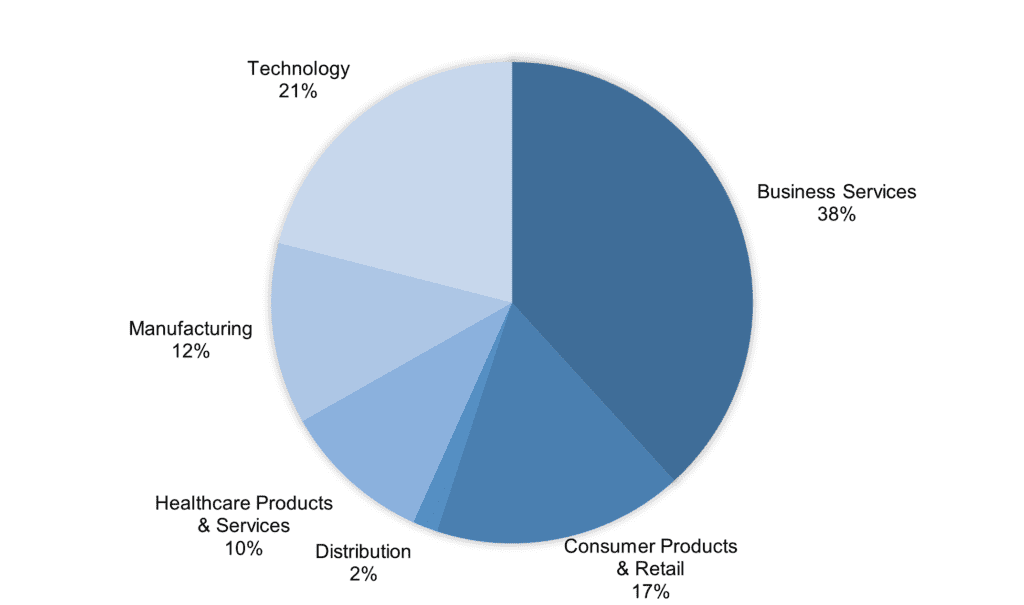
BUSINESS SERVICES AND TECHNOLOGY DEALS LEAD PACIFIC NORTHWEST REGION
Business Services and Technology transactions led Pacific Northwest M&A activity during the first half of 2022, consistent with previous periods.
1H 2022 Pacific Northwest Deal Activity by Industry
Source: PitchBook
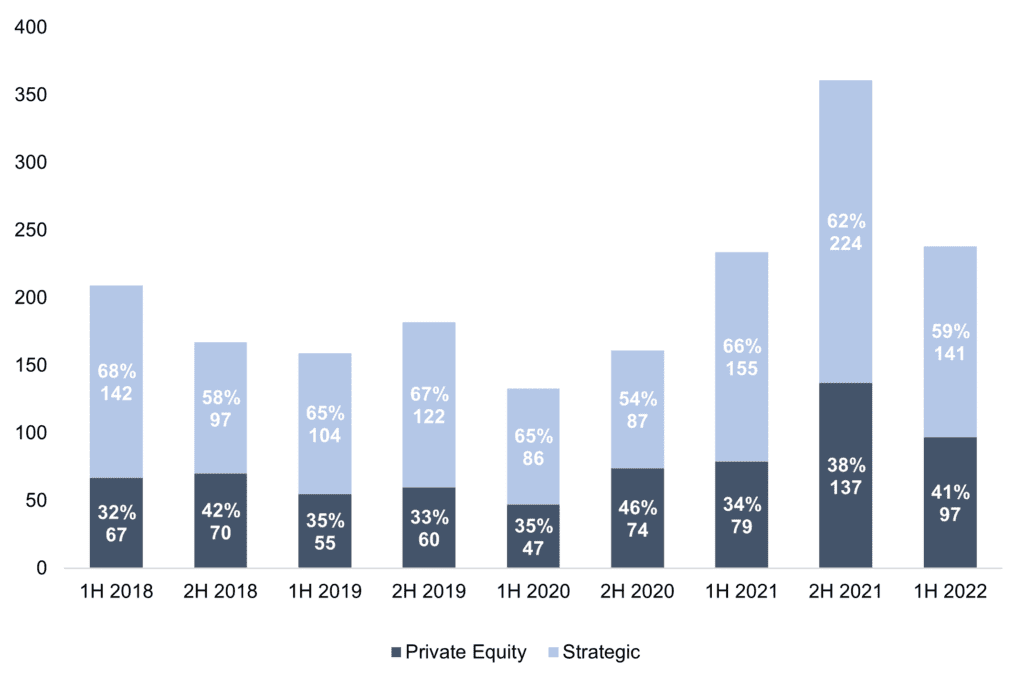
PRIVATE EQUITY INVESTORS REPRESENT A GROWING SHARE OF PNW DEALS
From 1H 2018 to 1H 2022, private equity transactions made up nearly 40% of deal activity in the Pacific Northwest. Private equity investors’ share of transactions in 1H 2022 represented 41% of transactions while strategic acquisitions represented 59%.
Pacific Northwest Deal Activity by Investor
Source: PitchBook
SELECT 1H 2022 PACIFIC NORTHWEST M&A TRANSACTIONS
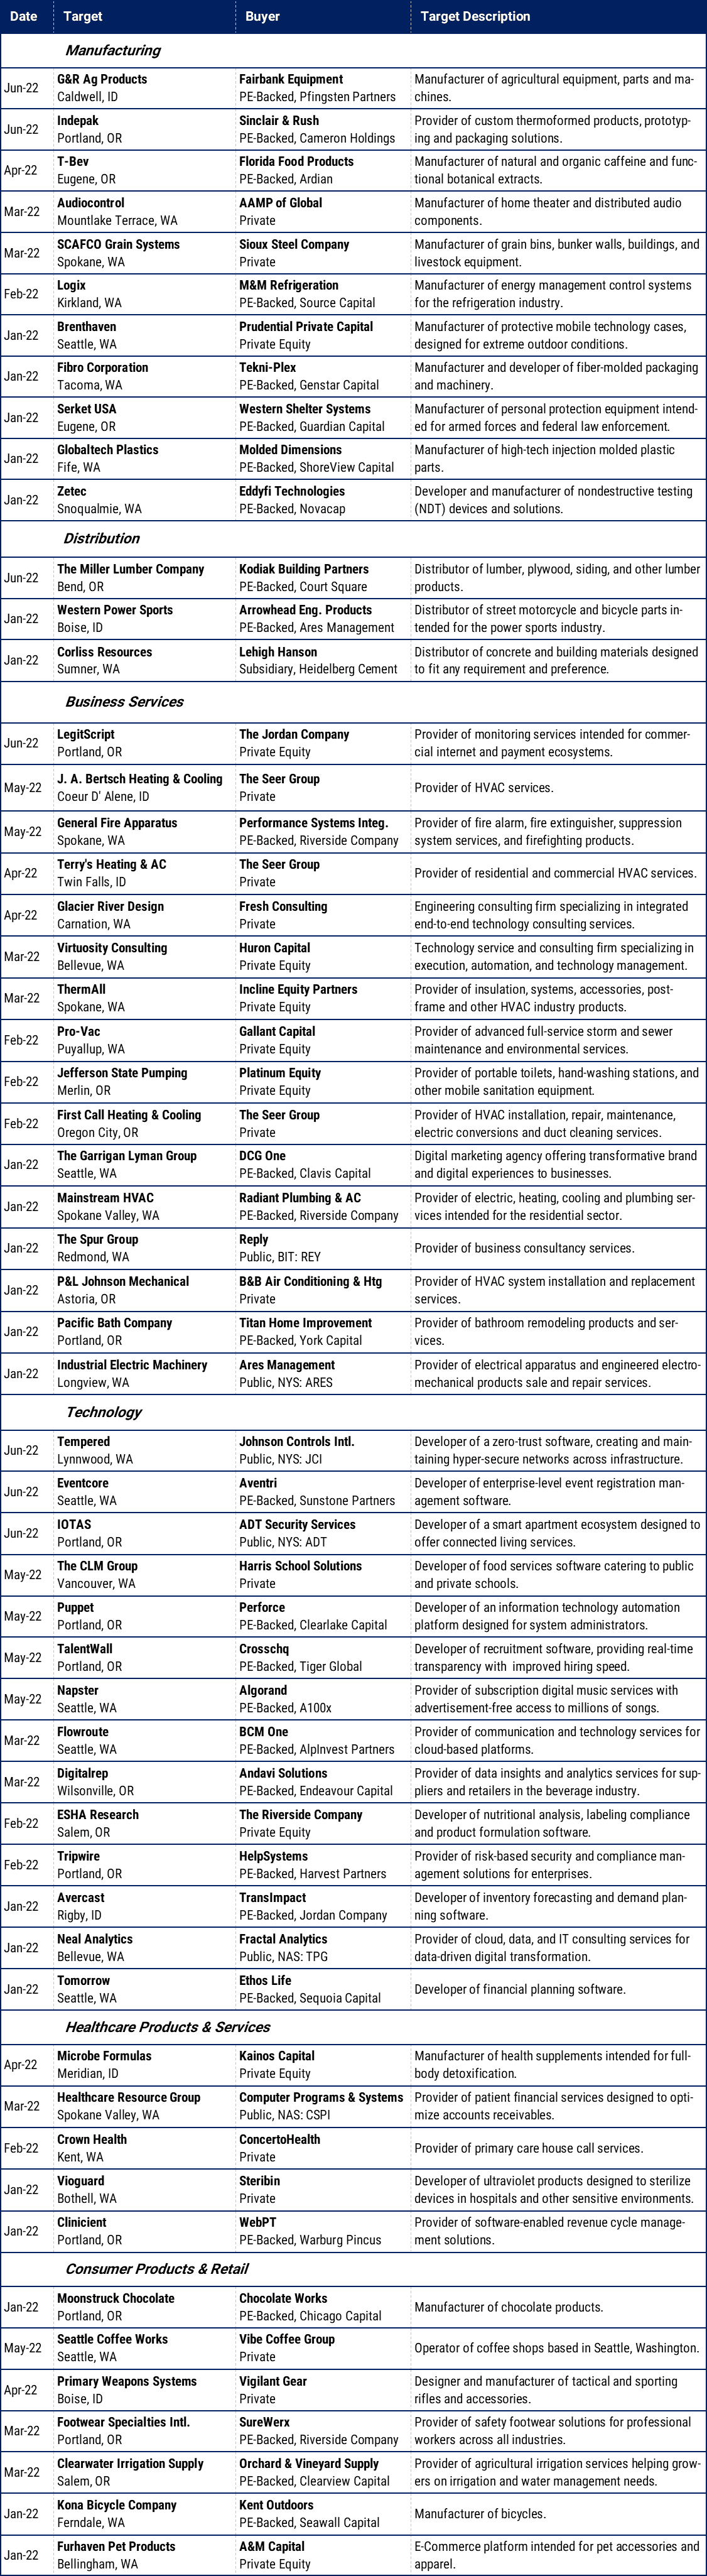
Sources: PitchBook, Portland Business Journal, Puget Sound Business Journal