The Chinook Report: 2H 2021
The latest bi-annual report of M&A activity, focusing on global, national, and regional (Pacific Northwest) trends. Includes profiles of transactions generally with an Enterprise Value (EV) between $10 and $100 million.
Click here to download a copy of this report.
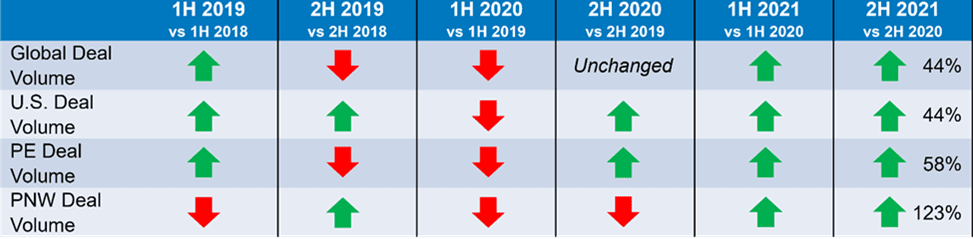
 CHINOOK M&A DASHBOARD
GLOBAL M&A DEAL ACTIVITY EXPLODES IN 2021
Record global M&A deal volume defined 2021. There were 20,211 transactions recorded in 2H 2021, 44% higher than the 14,018 recorded in 2H 2020 according to PitchBook’s 2021 Annual Global M&A Report. Deal volume in 2H 2021 increased 12% compared to the first half of 2021 when 18,019 transactions were closed.
Deal value followed a similar path during the last six months of the year. Global deal value increased 68% in 2H 2021 to $2.74 trillion compared to $1.63 billion in 2H 2020. Similarly, deal value increased 22% compared to the first half of 2021, when there was $2.24 trillion in deal value.
Despite record M&A activity, the COVID-19 pandemic continues to be a concern with the new global variants. In addition, global supply chain constraints are putting pressure on economies, from seaport backlogs to the lack of workers in key functions. Further, the war in Ukraine is expected to add pressures to commodity prices, including oil and natural gas.
Global M&A Activity (2014-2021)
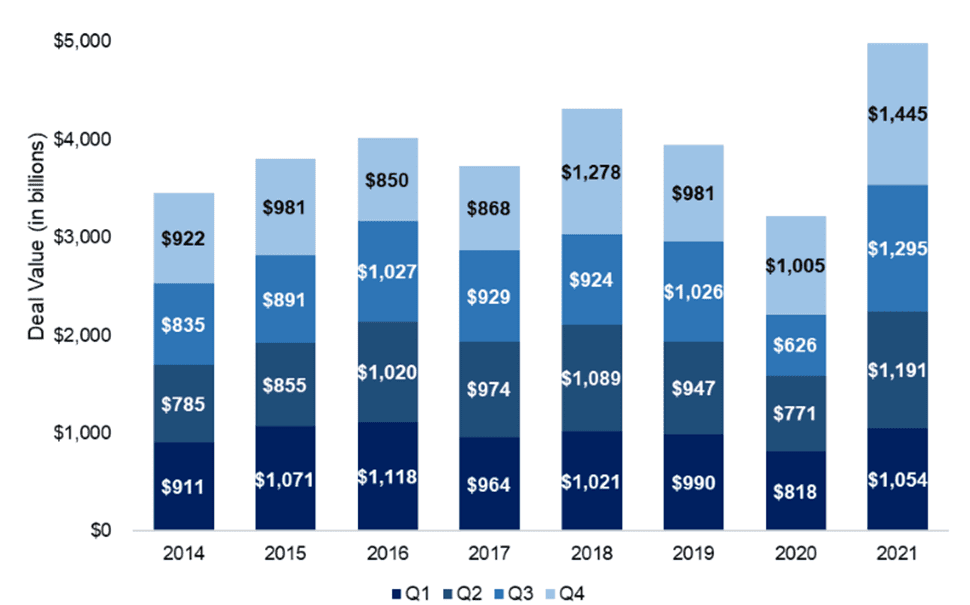
Source: Pitchbook 2021 Annual Global M&A Report
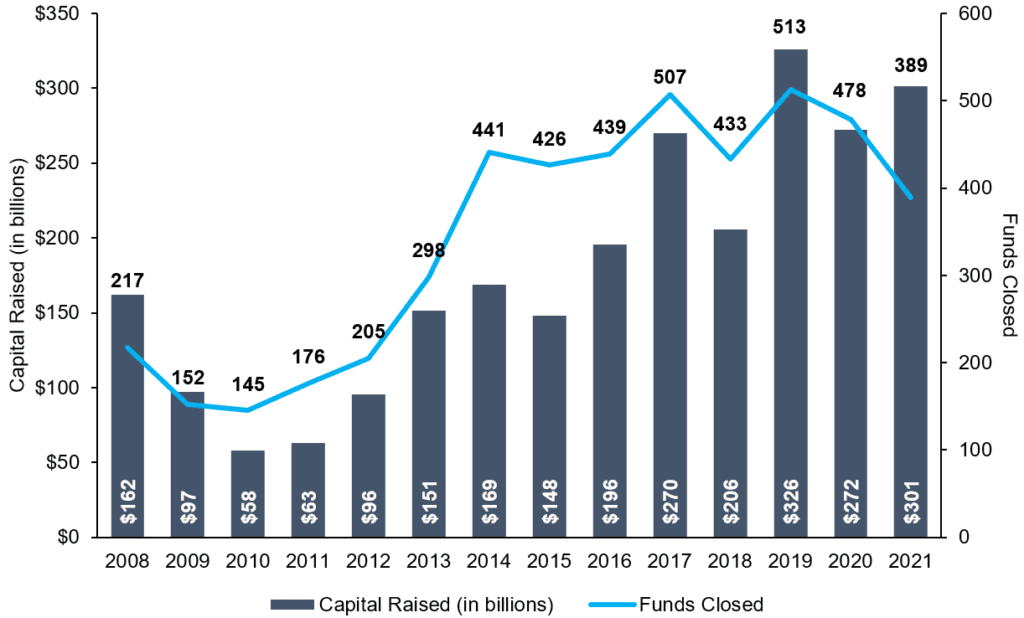
U.S. M&A ACTIVITY FOLLOWS SIMILAR GLOBAL TRENDS
2H 2021 U.S. M&A deal volume grew 44% to 10,221 transactions compared to 7,088 in the same period last year, according to PitchBook. U.S. M&A deal value was $1.6 trillion during the second half of the year, 80% higher than $892 billion in 2H 2020.
The U.S. inflation rate reached 7% in December 2021, the highest figure since the early 1980s. With rising costs, the Federal Reserve is planning on announcing changes to rates in 2022 which could have an impact on M&A.
The labor market continued to experience abnormal effects from the COVID-19 pandemic. According to The Washington Post, while the unemployment rate reached 4.2% in November 2021, 3.5 million fewer people are employed compared to 2019, and half that amount, 1.8 million people, are actively looking for a job. As a result, job openings in hospitality, restaurants, and retail are at record levels. Many sectors struggle to hire and retain workers.
U.S. M&A Activity (2008-2021)
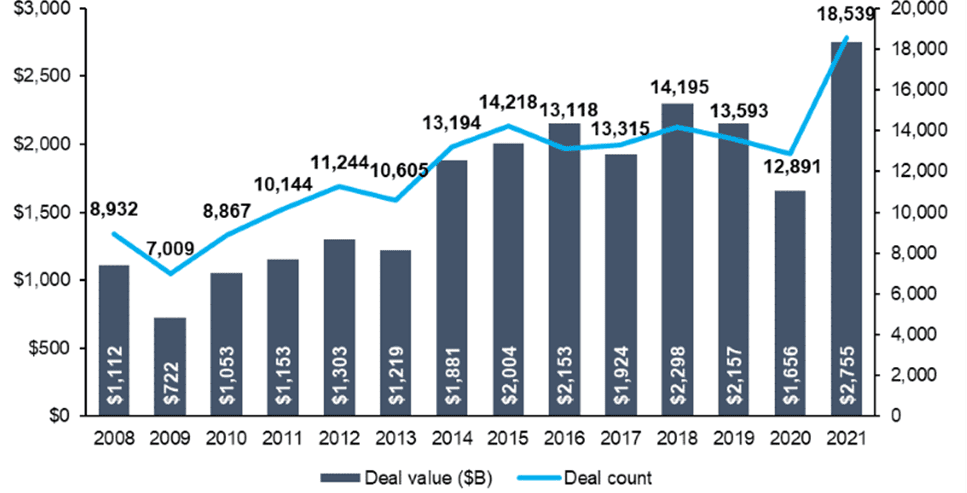
Source: PitchBook 2021 Annual Global M&A Report
U.S. PRIVATE EQUITY ACTIVITY CLIMBS IN 2H 2021
Following global M&A trends, U.S. private equity deal volume rose 58% during 2H 2021 to 4,916 transactions compared to 3,119 in the same period last year. In addition, deal value grew 85% to $781 billion compared to $422 billion in 2H 2020. Overall deal volume and value for U.S. private equity reached a record high in 2021 at $1.2 trillion, twice as high as 2020.
2021 was a record year for private equity mega-deals, representing 32% of all U.S. private equity deal value, according to PitchBook. In addition, a record 75 private-equity backed companies exited at valuations over $1 billion.
In 1H 2021, one tailwind to M&A activity was the imminent proposals for capital gains taxes. However, the current Administration has been unable pass capital gains and corporate tax rate rises throughout the second half of the year. Despite the gridlock, M&A activity is not expected to slow down in 2022.
U.S. PE Deal Activity (2008-2021)
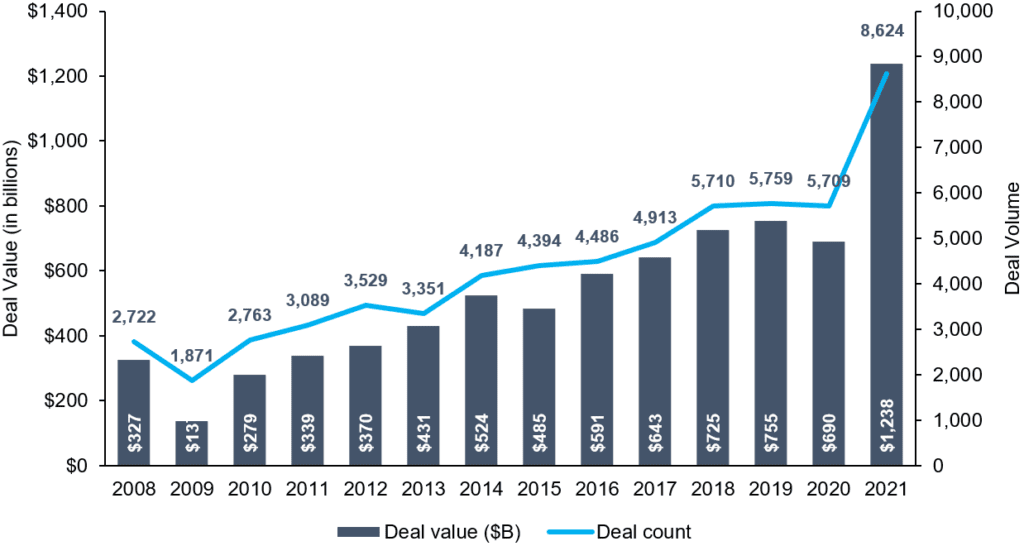
Source: PitchBook Annual 2021 US PE Breakdown
U.S. PRIVATE EQUITY FOLLOWS SIMILAR FUNDRAISING TRENDS IN 2021
During the second half of 2021, private equity firms raised $122 billion in capital, 29% lower compared to $171 billion during the same period last year. Despite a drop in fundraising in the second half, total fundraising for 2021 exceeded 2020 by 11%. Institutional and affluent investors continue to increase their private equity allocations as they chase stellar returns and avoid possible public market volatility.
U.S. PE Annual Fundraising Activity (2008-2021)
Source: PitchBook Annual 2021 US PE Breakdown
RECORD PRIVATE EQUITY DRY POWDER FOR DEPLOYMENT
With record amounts of dry powder for acquisitions, the push for private equity funds to find portfolio companies and add-ons continues. Favorable M&A and interest rates propel growth. Through 2021, cumulative dry powder in the United States increased to nearly $830 billion.
U.S. Cumulative Dry Powder (2008-2021)
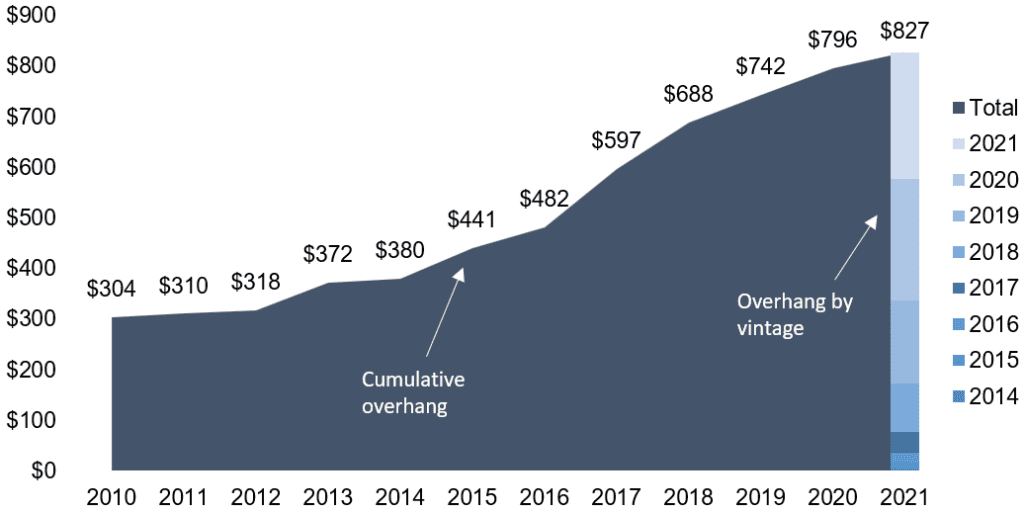
Source: PitchBook
LOWER-MIDDLE MARKET EBITDA MULTIPLES PAID BY PRIVATE EQUITY JUMP TO FOUR-YEAR HIGH
Average EBITDA multiples paid in 2021 by private equity groups for companies with an enterprise value between $10-25 million increased to 6.2x, a four-year high. The increase is consistent with the rise in multiples for companies at all enterprise value intervals.
EBITDA Multiples
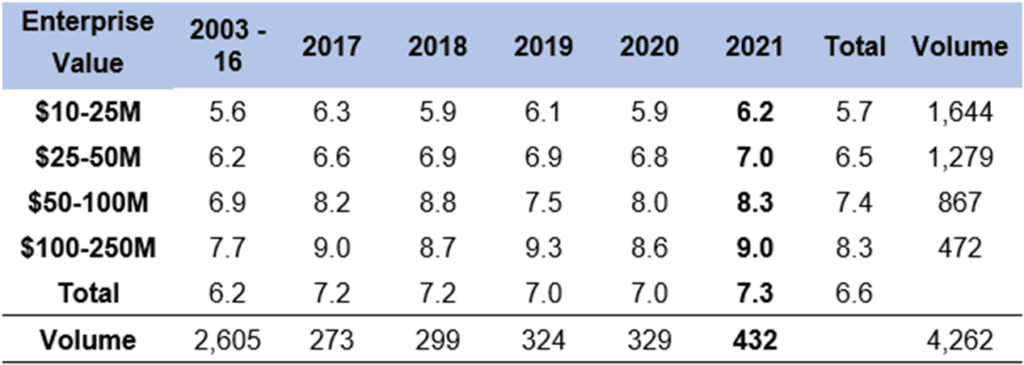
Source: GF Data M&A Report Spring 2022
2H 2021 PACIFIC NORTHWEST DEAL VOLUME REACHES HIGHEST LEVEL IN FIVE YEARS
Total deal volume in the Pacific Northwest increased 123% to 359 transactions in 2H 2021 compared to 133 in 2H 2020. Deal volume for 2021 is the highest annual total since 2016.
Pacific Northwest Deal Volume
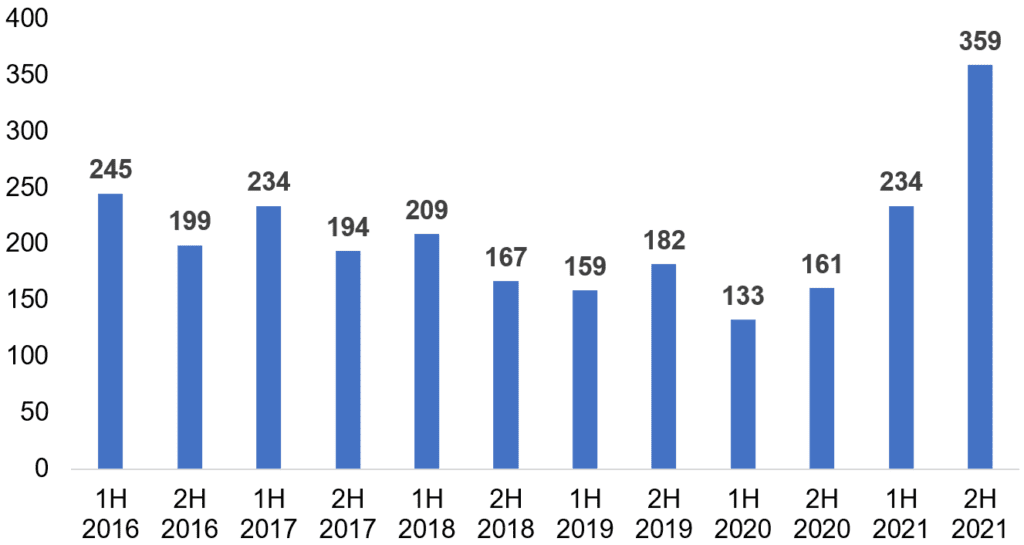
Source: PitchBook
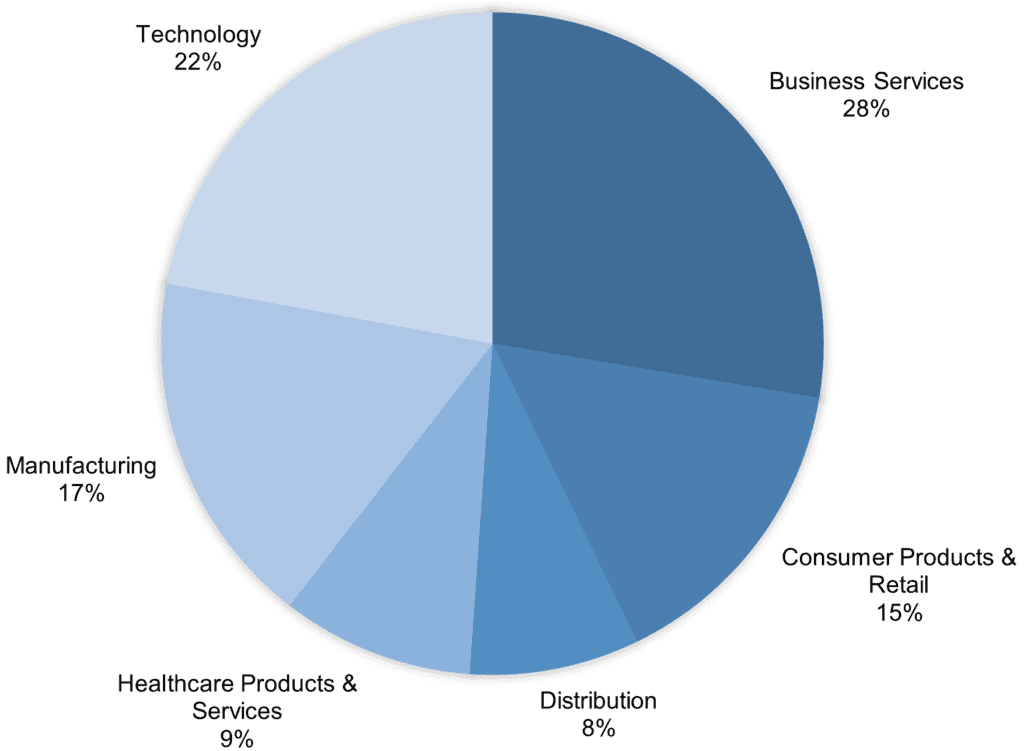
BUSINESS SERVICES AND TECHNOLOGY DEALS LEAD PACIFIC NORTHWEST REGION
Business Services and Technology transactions led Pacific Northwest M&A activity during the second half of 2021, consistent with previous periods.
2H 2021 Pacific Northwest Deal Activity by Industry
Source: PitchBook
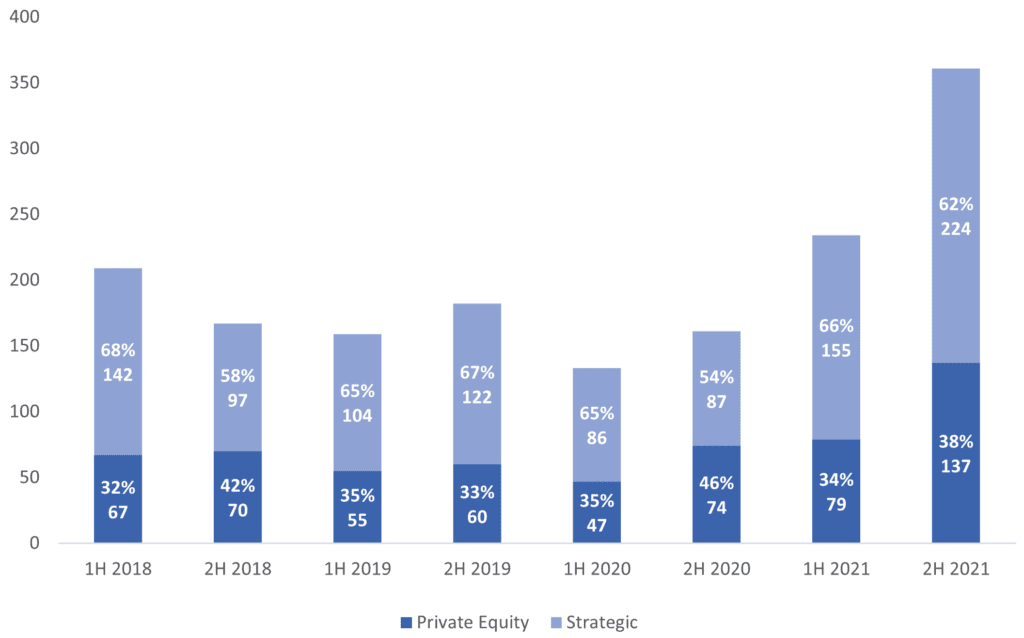
PRIVATE EQUITY INVESTORS REPRESENT A GROWING SHARE OF PNW DEALS
From 1H 2018 to 1H 2021, private equity transactions have represented 36% of deal activity in the Pacific Northwest. Private equity transactions in 2H 2021 increased to 38% of overall M&A while strategic acquirers represented 62%.
Pacific Northwest Deal Activity by Investor
Source: PitchBook
SELECT 2H 2021 PACIFIC NORTHWEST M&A TRANSACTIONS
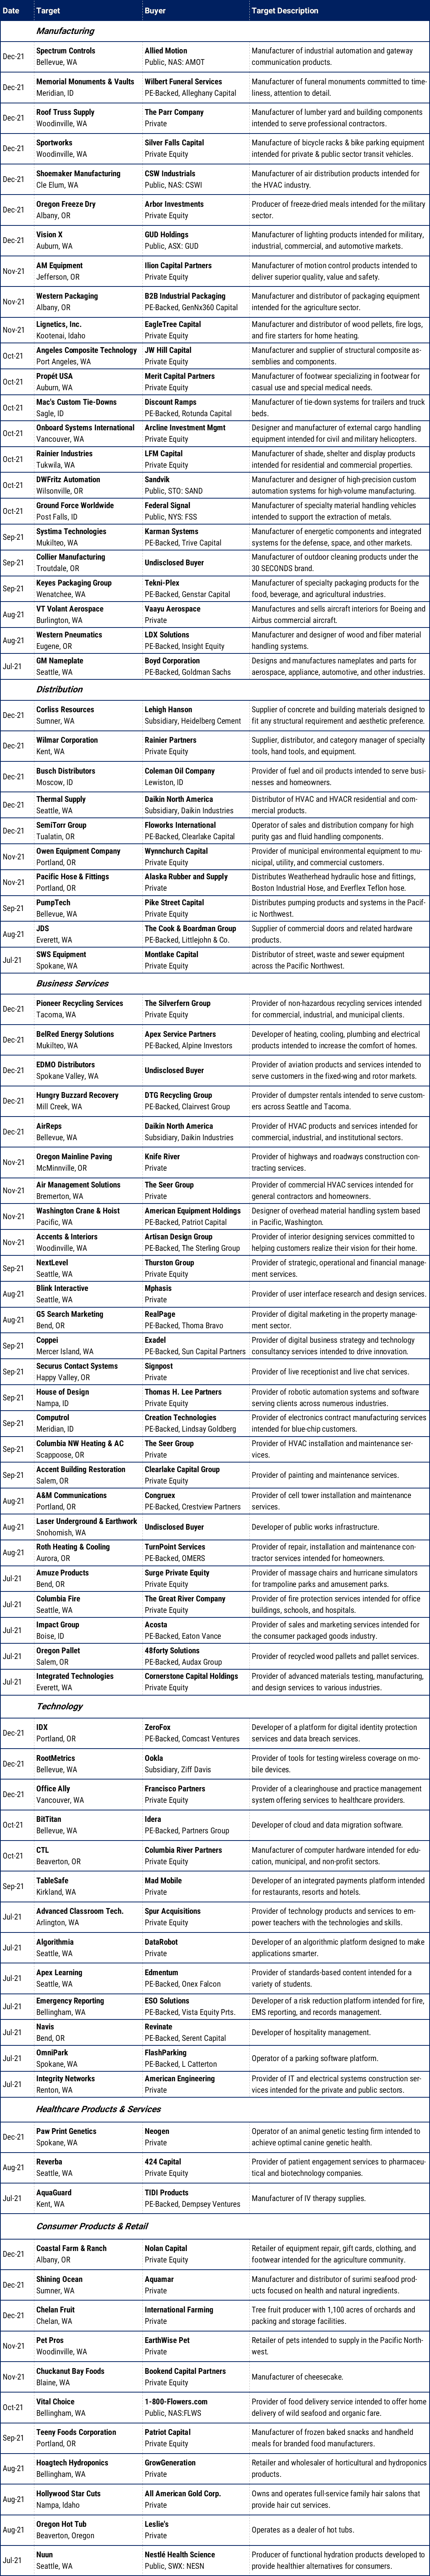
Sources: PitchBook, Portland Business Journal, Puget Sound Business Journal