The Chinook Report: 1H 2021
The latest bi-annual report of M&A activity, focusing on global, national, and regional (Pacific Northwest) trends. Includes profiles of transactions generally with an Enterprise Value (EV) between $10 and $50 million.
Click here to download a copy of this report.
 CHINOOK M&A DASHBOARD
 CHINOOK M&A DASHBOARD
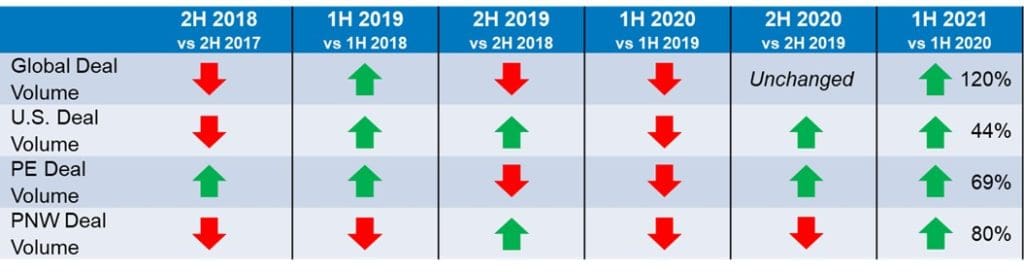
GLOBAL M&A DEAL ACTIVITY REACHES NEW HIGHS IN 1H 2021
Record global M&A deal volume defined the first half of 2021 compared to the same period last year. There were 15,200 transactions recorded in 1H 2021, an increase of 120% compared to 6,900 recorded in 1H 2020 according to a report by Mergermarket, an M&A research group. Deal volume increased 43% compared to the second half of 2020 when 10,612 transactions were closed.
Deal value followed a similar path during the first six months of the year. Global deal value increased 300% in 1H 2021 to $2.9 trillion compared to $966 billion in 1H 2020. Similarly, deal value increased 38% compared to the second half of 2020, when there was $2.1 trillion in deal value.
“Mega-deals”, or transactions over $2 billion in value, continued an upward trend of 22% to an all-time high of 111 transactions compared to 2019.
While the COVID-19 vaccine reaches record levels of populations globally, the pandemic continues to hinder recovery plans, especially the highly contagious Delta variant. Despite this, global M&A reached record highs during the first six months of 2021.
Global M&A Activity (2014-2021)
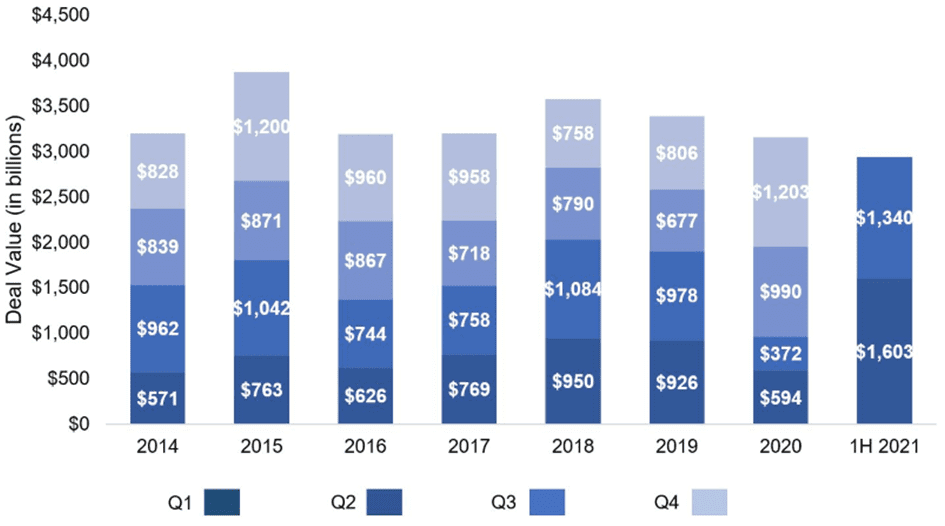
Source: Mergermarket M&A Highlights First Half 2021
U.S. M&A ACTIVITY FOLLOWS SIMILAR GLOBAL TRENDS
1H 2021 U.S. M&A deal volume grew 44% to 8,193 transactions compared to 5,675 in the same period last year, according to PitchBook. U.S. M&A deal value was $1.1 trillion during the first half of the year, 43% higher than $770 billion in 1H 2020.
While the COVID-19 pandemic continues to impact Americans, record vaccinations and looser restrictions are improving the pace of economic recovery. Investor confidence remains optimistic as equity markets reach new records. The S&P 500 rose 16% during the first six months of 2021 compared to a 5% slump in the same period last year.
Despite the rebound, bottlenecks and record demand post-lockdown resulted in higher inflation; the consumer price index increased 5% in June 2021 compared to the same month last year. Furthermore, supply chain issues have caused global shortages for computer chips, limiting the recovery of various industries including automotive, electronics, and others.
U.S. M&A Activity (2008-2021)
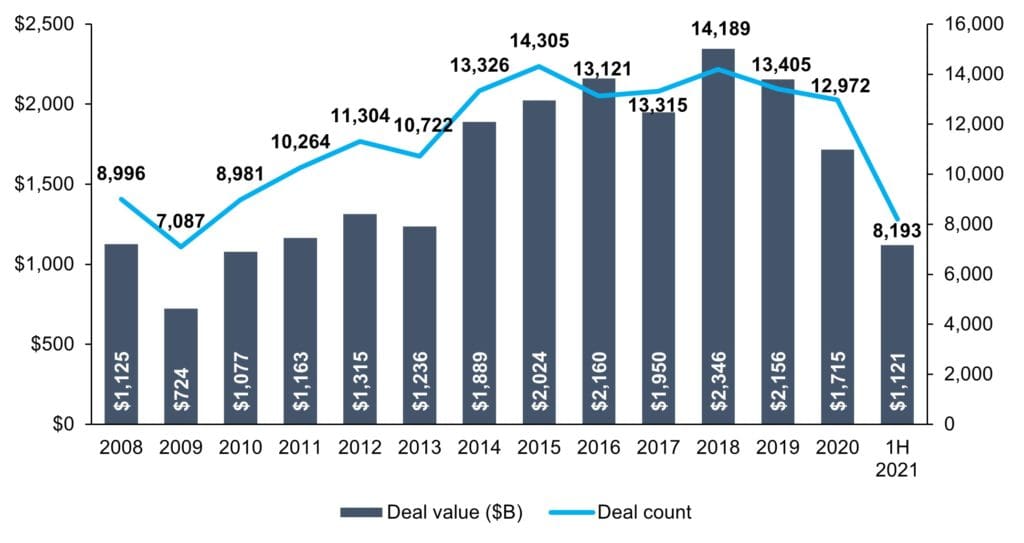
Source: PitchBook Q2 2021 Global M&A Report
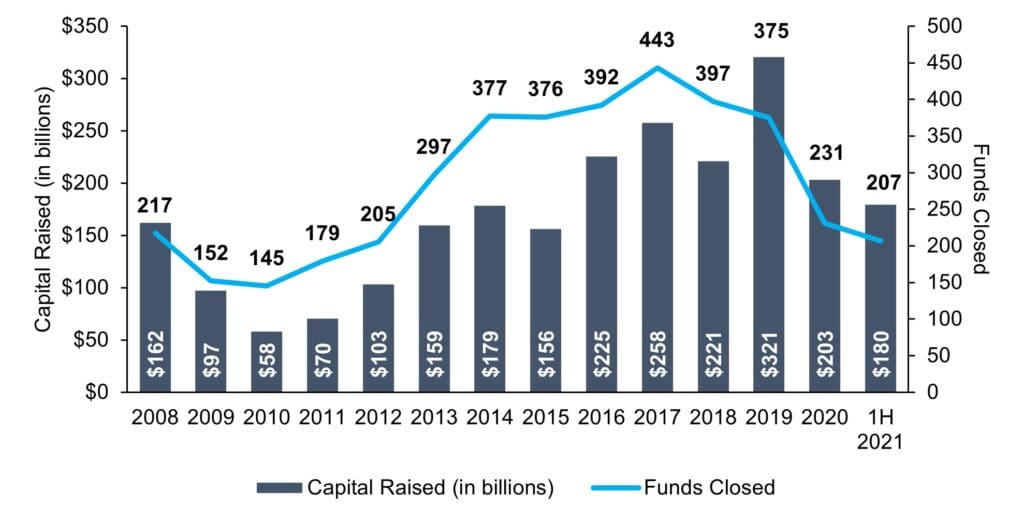
U.S. PRIVATE EQUITY ACTIVITY CLIMBS IN 1H 2021
Following global M&A trends, U.S. private equity deal volume rose 71% during 1H 2021 to 3,708 transactions compared to 2,173 in the same period last year. In addition, deal value grew 39% to $456 billion compared to $327 billion in 1H 2020. Deal value for the first half of 2021 was nearly two-thirds the deal value recorded in 2020.
The Biden Administration’s proposed increase in the marginal capital gains rate is playing a major role in the growth of M&A activity as business owners take advantage of the current tax environment to liquidate their holdings. While the new administration has a pathway to enact legislation with control of both the House and Senate, it remains to be seen when new tax legislation will be signed into law and its effect on 2021 M&A activity. To learn more, please read our article “Counting Down to Higher Taxes.”
U.S. PE Deal Activity (2008-2021)
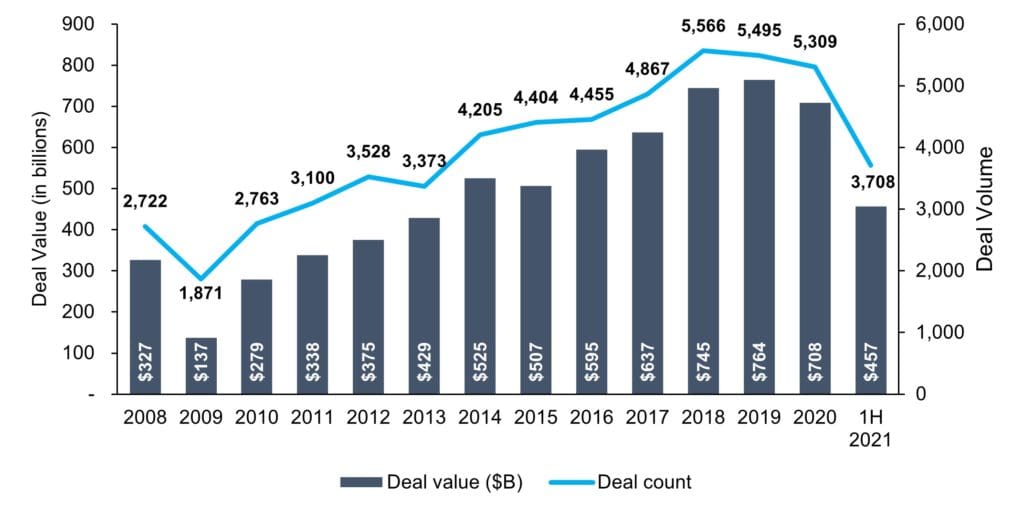
Source: PitchBook Annual 2021 US PE Breakdown
U.S. PRIVATE EQUITY FOLLOWS SIMILAR FUNDRAISING TRENDS IN 2021
During the first half of 2021, private equity firms raised $180 billion, 76% higher compared to $102 billion during the same period last year. This follows longer-term fundraising trends as investors remain focused on the alternatives market.
U.S. PE Annual Fundraising Activity (2008-2021)
Source: PitchBook Annual 2021 US PE Breakdown
RECORD PRIVATE EQUITY DRY POWDER FOR DEPLOYMENT
With record amounts of dry powder for acquisitions, the push for private equity funds to find portfolio companies and add-ons continues. Favorable M&A and interest rate seller trends are propelling growth. Through December 2020, cumulative dry powder in the United States remained steady at $703 billion.
U.S. Cumulative Dry Powder (2008-2020)
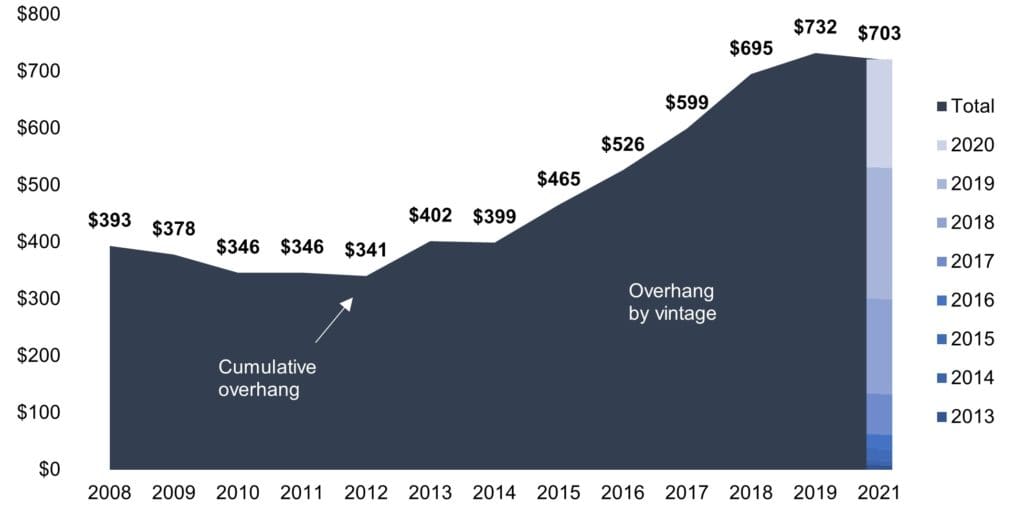
Source: PitchBook
LOWER-MIDDLE MARKET EBITDA MULTIPLES PAID BY PRIVATE EQUITY REMAIN STEADY
According to GF Data, average EBITDA multiples paid in the first six months of 2021 by private equity groups for companies with an enterprise value between $10-25 million remained steady at 5.9x, consistent with the full-year 2020 average of 5.9x.
EBITDA Multiples
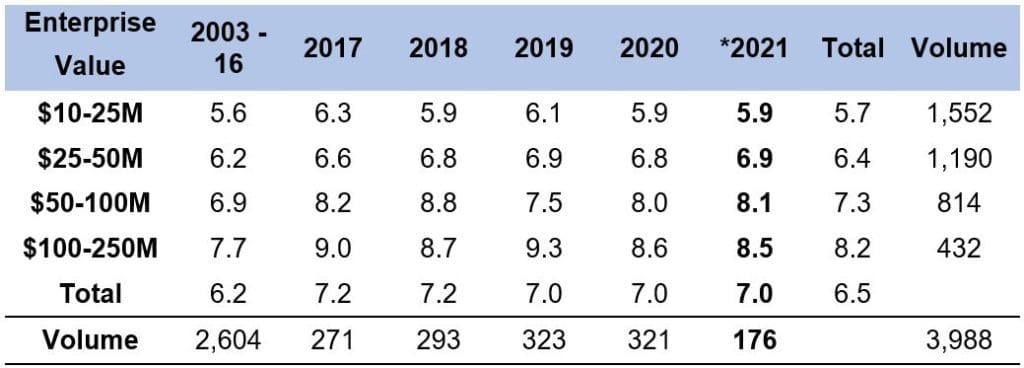
*Data through June 31
Source: GF Data M&A Report August 2021
1H 2021 PACIFIC NORTHWEST DEAL VOLUME HIGHEST LEVEL IN FOUR YEARS
Total deal volume in the Pacific Northwest increased 80% to 239 transactions in 1H 2021 compared to 133 in 1H 2020. Deal volume in the first half of 2021 is the highest semi-annual total since the first half of 2016.
Pacific Northwest Deal Volume (2016-2021)
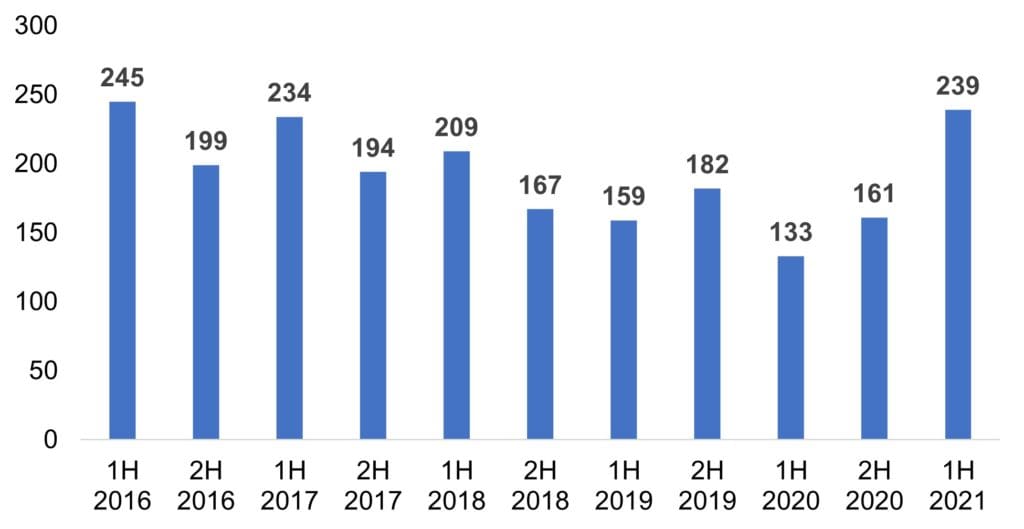
Source: PitchBook
BUSINESS SERVICES AND TECHNOLOGY DEALS LEAD PACIFIC NORTHWEST REGION
Business Services and Technology transactions led Pacific Northwest M&A activity during the first half of 2021, similar to previous periods.
1H 2021 Pacific Northwest Deal Activity by Industry
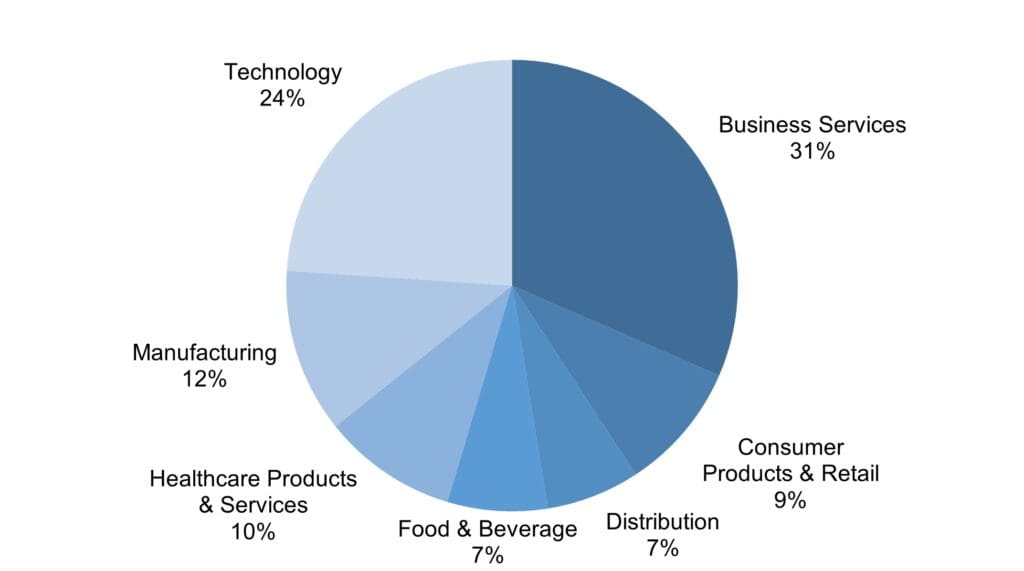
Source: PitchBook
PRIVATE EQUITY INVESTORS REPRESENT SIGNIFICANT SHARE OF PNW DEALS
Since 1H 2018, private equity transactions have represented 35% of deal activity in the Pacific Northwest. 1H 2021 followed this trend as private equity investors represented 34% of transactions while strategic acquisitions represented 66%.
Pacific Northwest Deal Activity by Investor
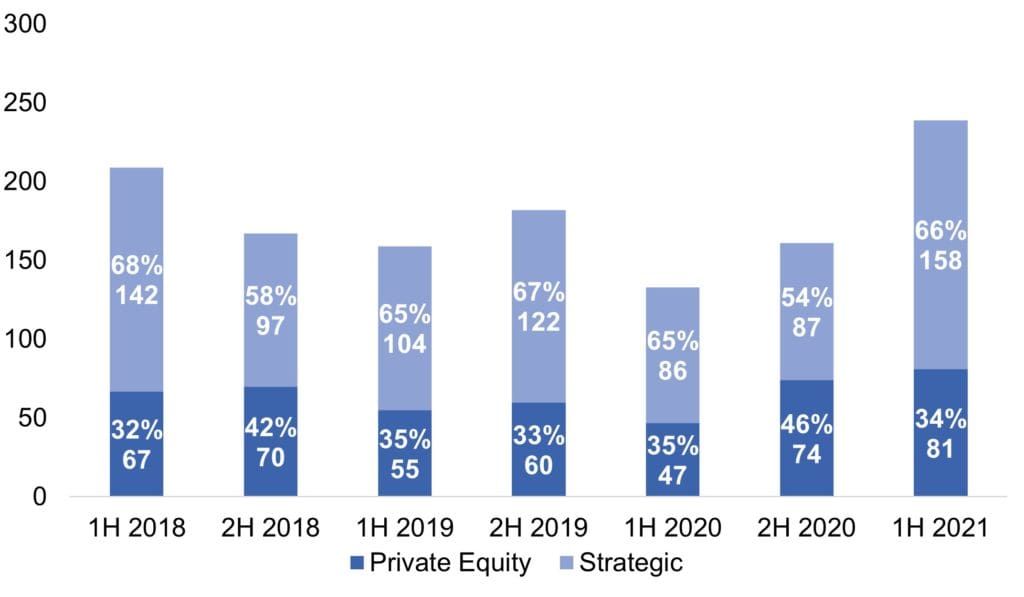
Source: PitchBook
SELECT 1H 2021 PACIFIC NORTHWEST M&A TRANSACTIONS
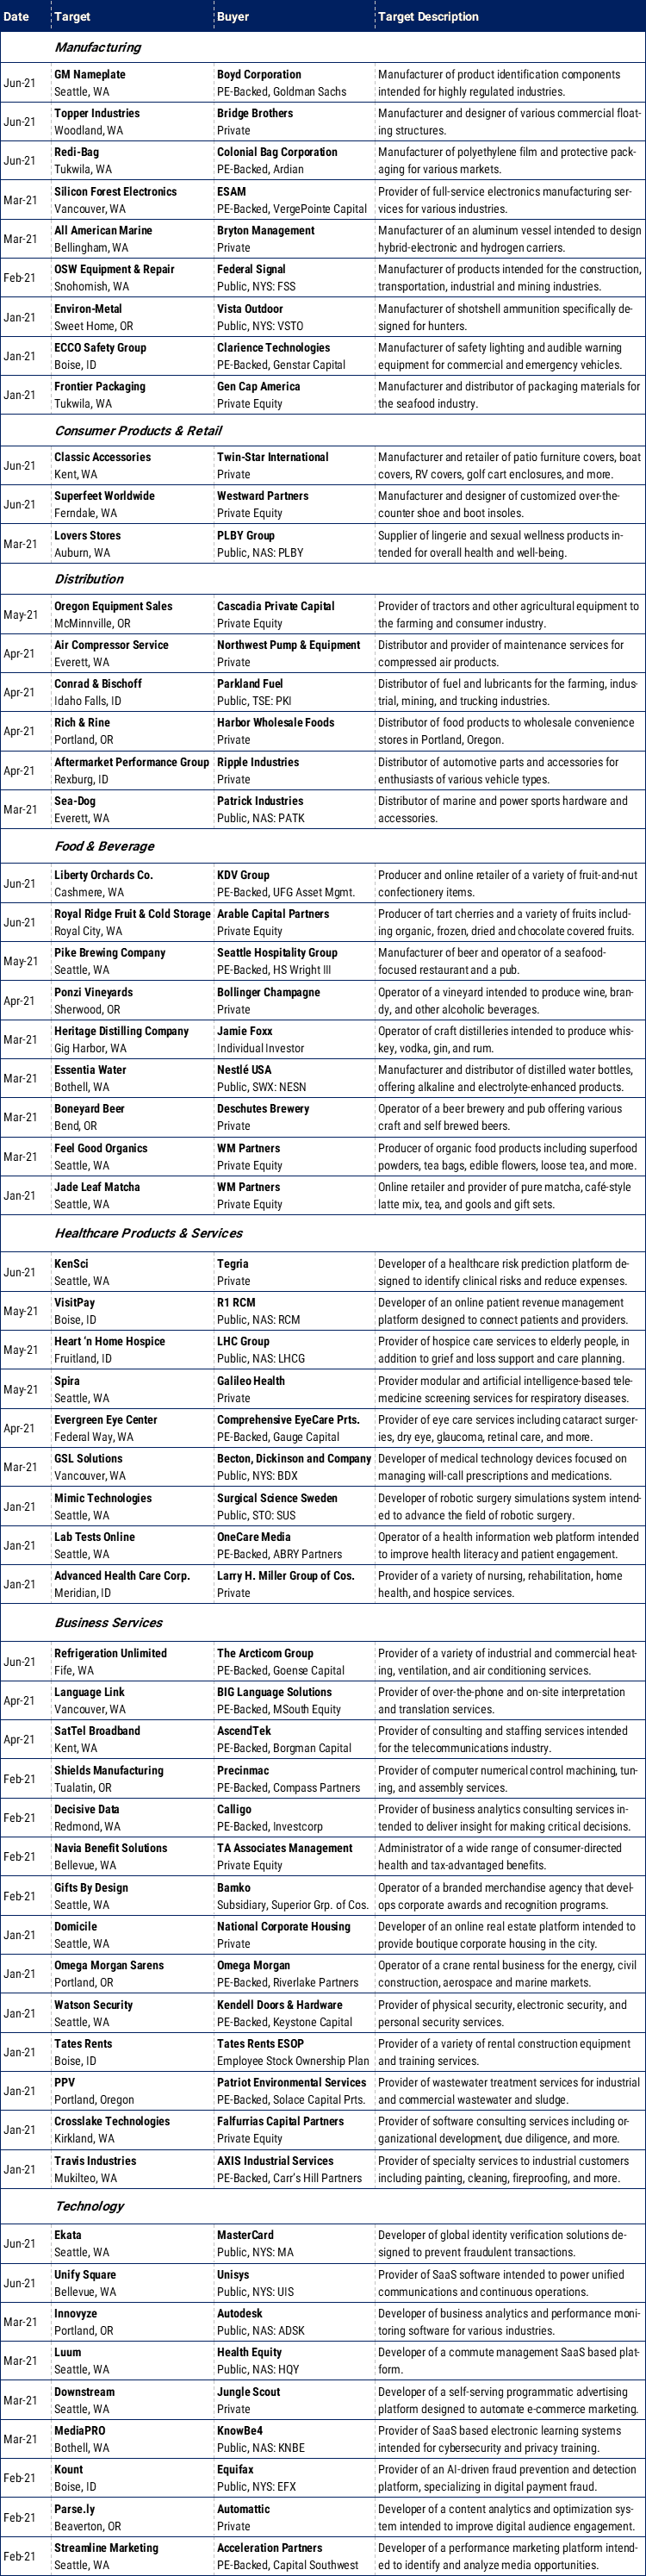
Sources: PitchBook, Portland Business Journal, Puget Sound Business Journal