The Chinook Report: 2H 2020
This report is published twice a year and provides an update on M&A activity for the second half of 2020 with a focus on global, national, and Pacific Northwest trends. Selected transactions are profiled with an Enterprise Value (EV) generally between $10 million and $50 million. Our data is sourced from PitchBook, GF Data, and other public resources.
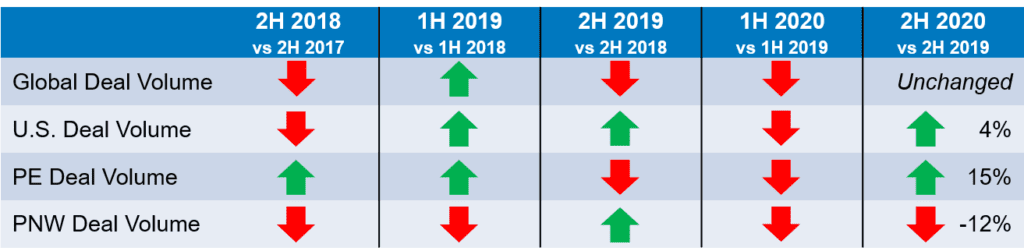
 CHINOOK M&A DASHBOARD
GLOBAL M&A DEAL ACTIVITY AND VALUE REBOUNDED IN 2H 2020
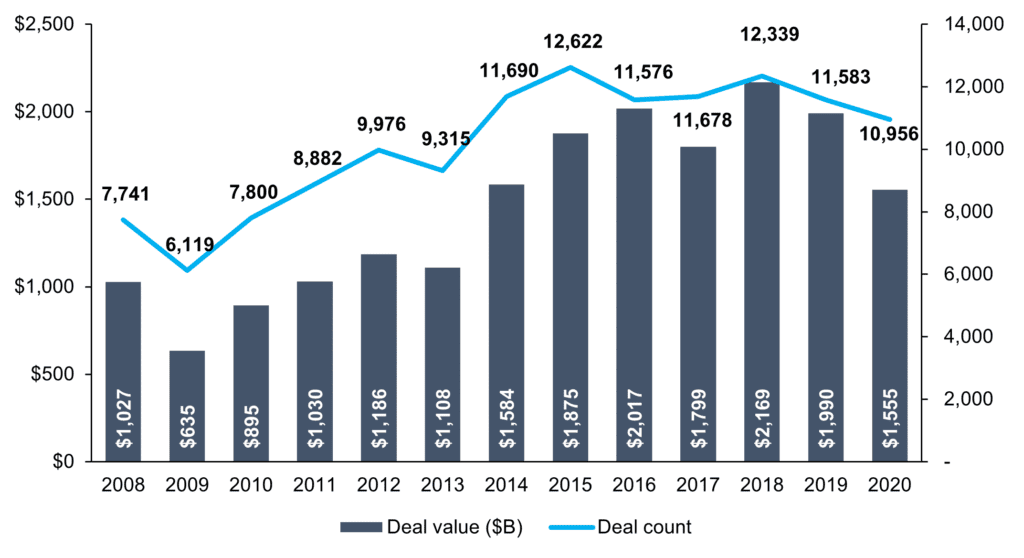
Global M&A deal volume in 2H 2020 was in-line with 2H 2019. There were 10,600 deals recorded in both periods according to a report by Mergermarket, an M&A research group. Despite the impact of COVID felt globally, deal volume rebounded 53% compared to the first half of the year when only 6,900 transactions were completed. Overall, 2020 deal volume decreased 15% to 17,545 transactions compared to 20,767 transactions in 2019.
Deal value told a different story in 2020. Global deal value increased 48% in the second half of 2020 to $2.1 trillion compared to $1.5 trillion in the second half of 2019. With the slowdown of activity in the first half of 2020 of $966 billion, deal value increased 127% in the second half of the year. 2020 annual deal volume was $3.1 trillion, a 7% decline from $3.4 trillion in 2019.
2020 presented an interesting dichotomy of trends with respect to deal values. 2020 “mega-deals”, or transactions over $5 billion in value, surged 22% to an all-time high of 111 transactions. On the other hand, deals valued under $250 million declined 12% compared to 2019.
As the world continues to reel from the economic effects of COVID, M&A activity remains healthy.
Global M&A Activity (2014-2020)
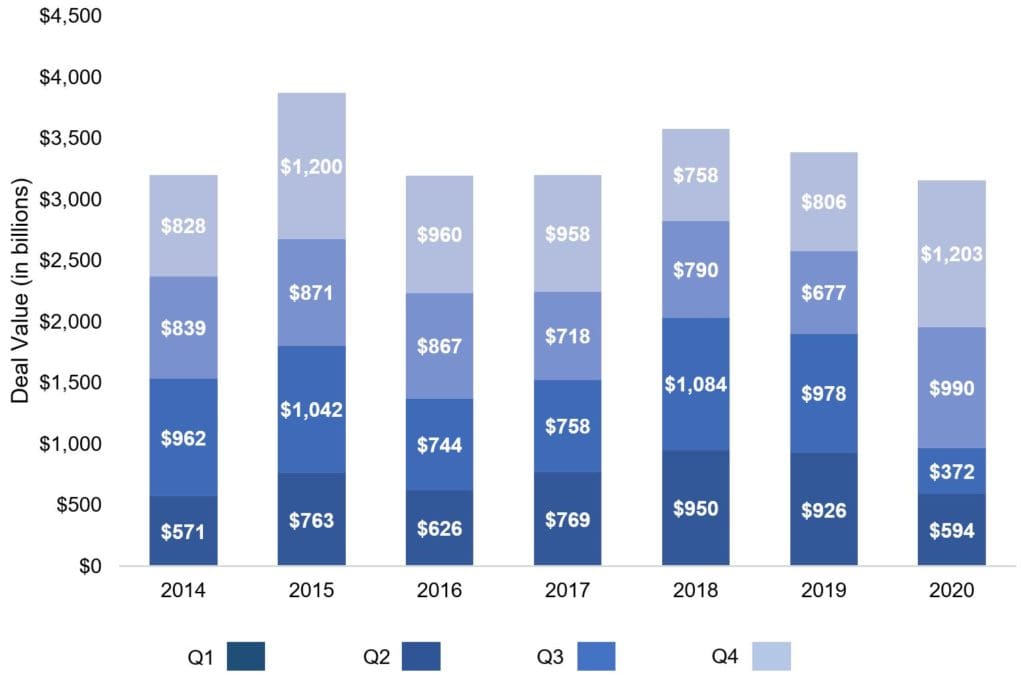
Source: Mergermarket Global & Regional M&A Report 2020
U.S. M&A ACTIVITY FOLLOWED SIMILAR GLOBAL TRENDS
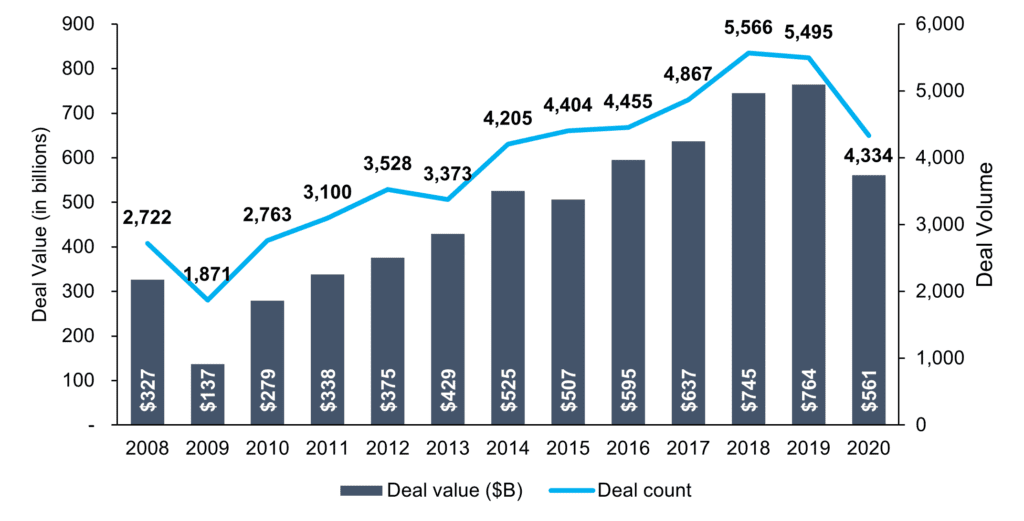
2H 2020 U.S. M&A deal volume grew 4% to 5,933 from 5,722 in the same period last year, according to PitchBook. U.S. M&A deal value was $857 billion during the second half of the year, nearly 20% lower than $1.1 trillion in 2H 2019.
Overall, 2020 U.S. deal volume and values followed global trends as compared with 2019: volumes were down 5% from 11,583 to 10,956 while value dropped 20% from $2 trillion to $1.6 trillion.
The encouraging uptick in M&A activity in the second half of 2020 illustrated the reality that deals could close during the COVID period. Public markets continue reached record highs in 2020. For example, the S&P 500 grew 18% despite a 32% drop in 2Q 2020.
As a result of the November 2020 elections, the Biden administration has proposed tax legislation that includes the following changes:
1. Doubling the top capital gains rate from 20% to 39.6% for individuals with $1M or more in adjusted gross income;
2. Raising the top ordinary income tax rate from 37% to 39.6%; and
3. Boosting corporate income tax rate from 21% to 28%.
While the new administration has a pathway to enact legislation with control of both the House and Senate, it remains to be seen when new tax legislation will be signed into law. Concerns over potential tax increases is a driving force for 2021 deal activity.
U.S. M&A Activity (2008-2020)
Source: PitchBook 2020 Annual North American M&A Report

U.S. PRIVATE EQUITY DEAL ACTIVITY CLIMBED IN 2H 2020
U.S. private equity deal volume during 2H 2020 rose 15% to 3,119 transactions, compared to 2,703 in the same period last year. In addition, deal value also rose to $422 billion, a 16% increase compared to $364 billion in 2H 2019.
Overall deal volume dropped 21% to 4,334 transactions during 2020 compared to 5,495 in 2019, according to PitchBook. Overall deal value dropped 27% to $561 billion in 2020 compared to $764 billion last year.
Despite the decline in activity, private equity firms continue to look for opportunities, especially in COVID-resistant industries such as e-commerce, technology, and healthcare services. To “normalize” 2020 performance, sellers and their advisors are focusing on earnings adjusted for the COVID impact. To learn more, please read our article, “How COVID is Impacting Private Company Valuations.”
U.S. PE Deal Activity Activity (2008-2020)
Source: PitchBook Annual 2020 U.S. PE Breakdown
FUNDRAISING STALLS FOR U.S. PRIVATE EQUITY FIRMS
Despite COVID headwinds, private equity funds raised $203 billion in 2020, 37% lower than the record $321 billion in 2019.
U.S. PE Annual Fundraising Activity (2008-2020)
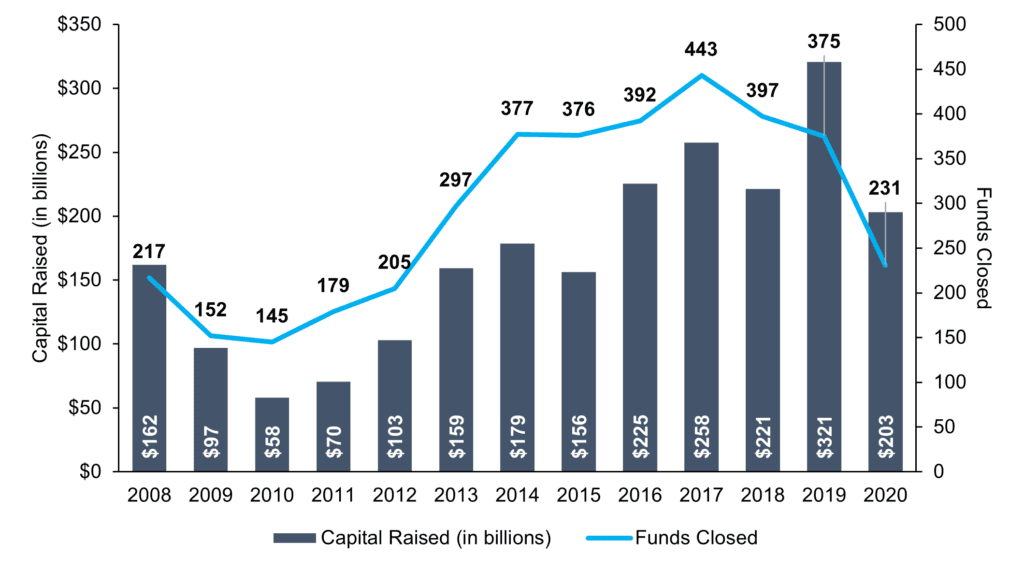
Source: PitchBook Annual 2020 US PE Breakdown
CUMULATIVE DRY POWDER STILL ABOVE $700 BILLION
Private equity funds continue to stockpile record amounts of dry powder for acquisitions; since these funds will need to be deployed in a finite period, the push to find portfolio companies and add-ons that fit within their investment theses continues. Through June 2020, cumulative dry powder in the United States remained steady at $721 billion, a decrease of 2% from the previous year.
U.S. Cumulative Dry Powder (2008-2020)
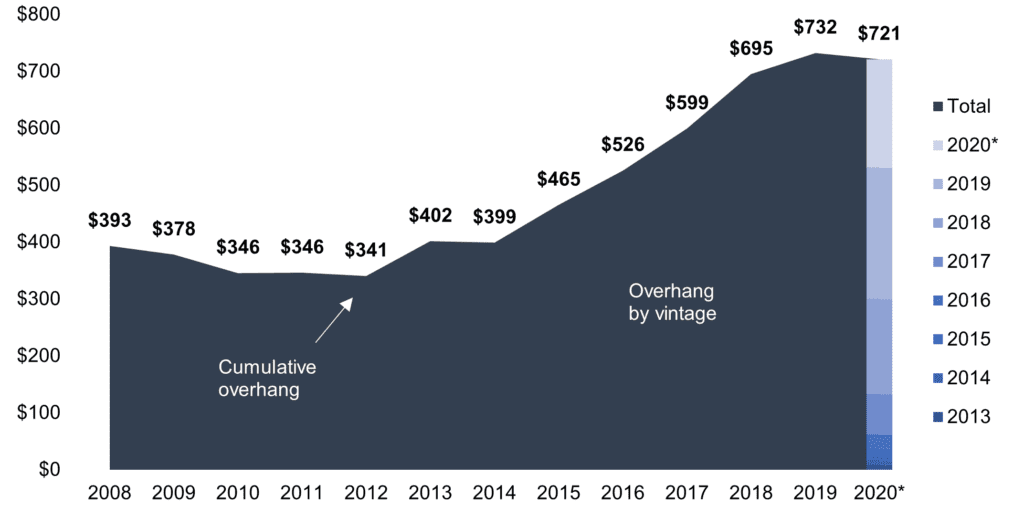
*2020 through June 30. Source: PitchBook
LOWER-MIDDLE MARKET EBITDA MULTIPLES PAID BY PRIVATE EQUITY DROP SLIGHTLY
Average EBITDA multiples paid in 2020 by private equity groups for companies with an enterprise value between $10-25 million dropped to 6.0x, lower than the full-year 2019 average of 6.2x.
EBITDA Multiples
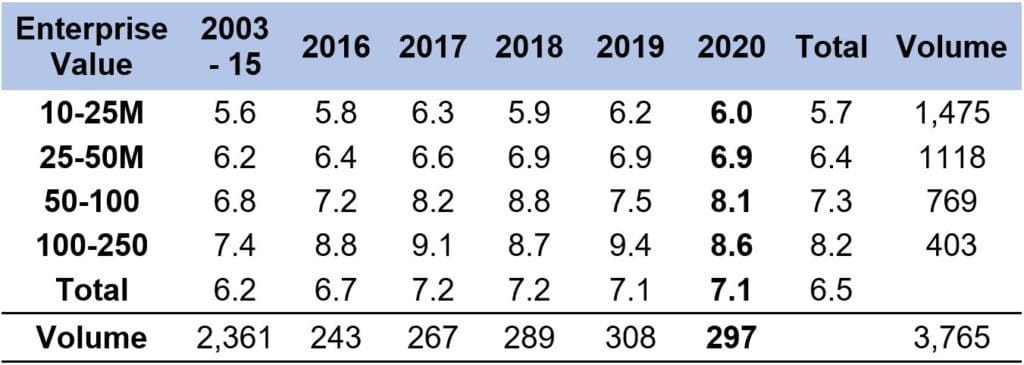
Source: GF Data M&A Report February 2021
2H 2020 PACIFIC NORTHWEST DEAL VOLUME JUMPED FROM 1H 2020 DROP
Total deal volume in the Pacific Northwest decreased 12% to 161 transactions in the second half of 2020 compared to 182 during the same period last year. Compared to the first half of the year with 133 transactions, deal volume increased 21%. Annually, 2020 Pacific Northwest deal volume dropped 14% compared with 2019.
Pacific Northwest Deal Volume (2016-2020)
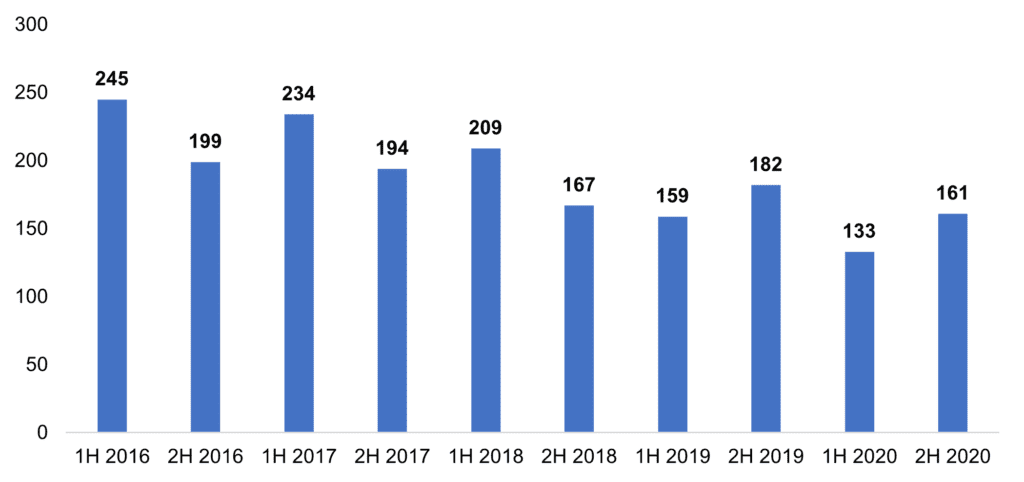
Source: PitchBook
BUSINESS SERVICES AND TECHNOLOGY LEAD PACIFIC NORTHWEST REGION
Business Services and Technology transactions led Pacific Northwest M&A activity during the second half of 2020, similar to previous periods.
2H 2020 Pacific Northwest Deal Activity by Industry
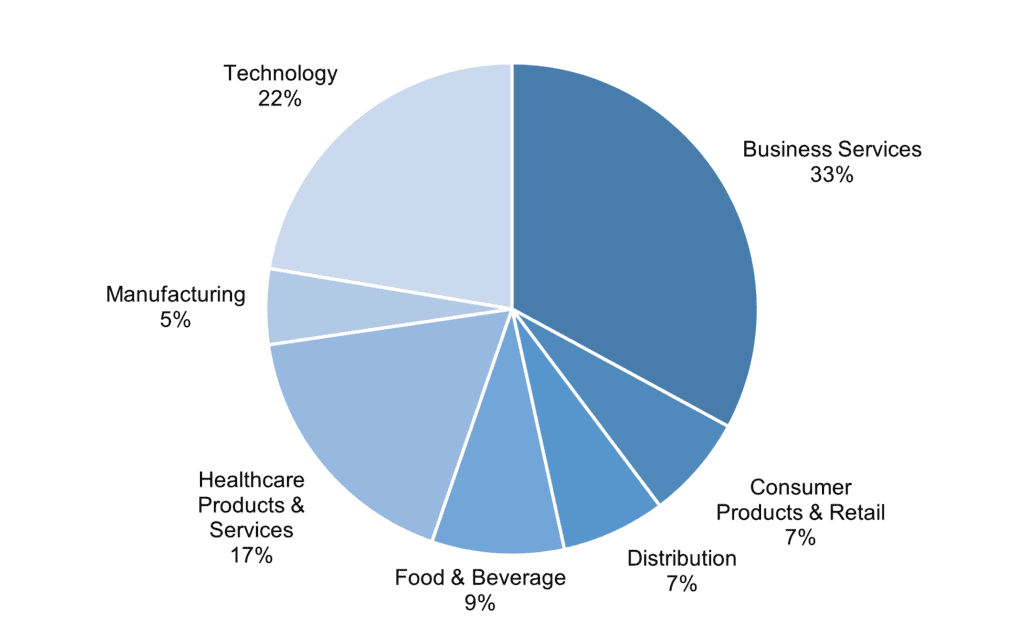
Source: PitchBook
PRIVATE EQUITY BUYERS REPRESENTING LARGER SHARE OF PNW DEALS
On average, private equity transactions have represented 35% of deal activity in the Pacific Northwest. However, during the second half of 2020, private equity transactions represented 46% of all activity, the biggest percentage over the past three years.
Pacific Northwest Deal Activity by Investor Type
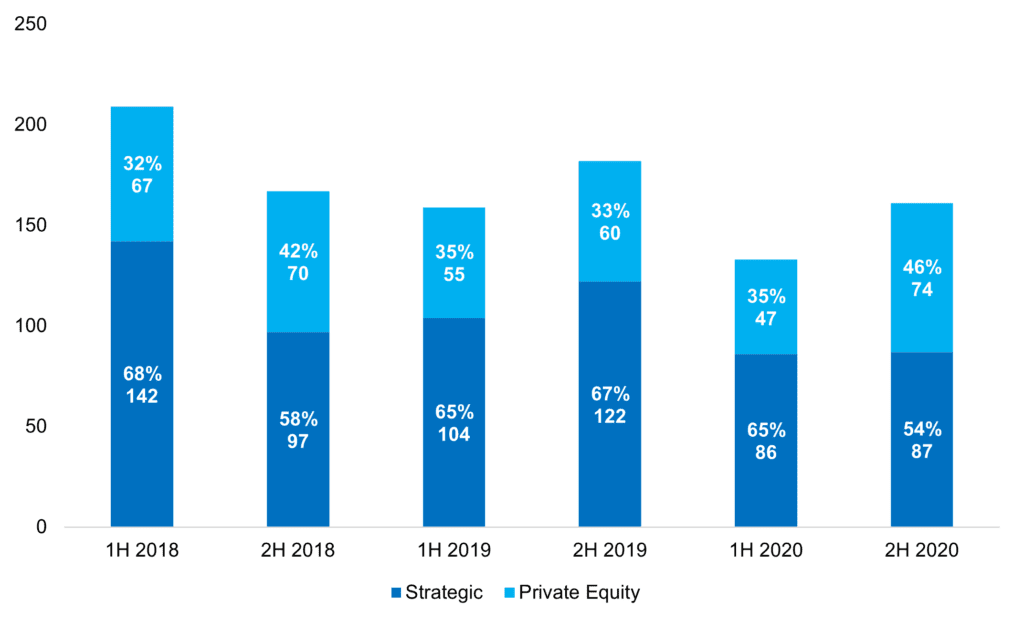
Source: PitchBook
SELECT 2H 2020 PACIFIC NORTHWEST M&A TRANSACTIONS
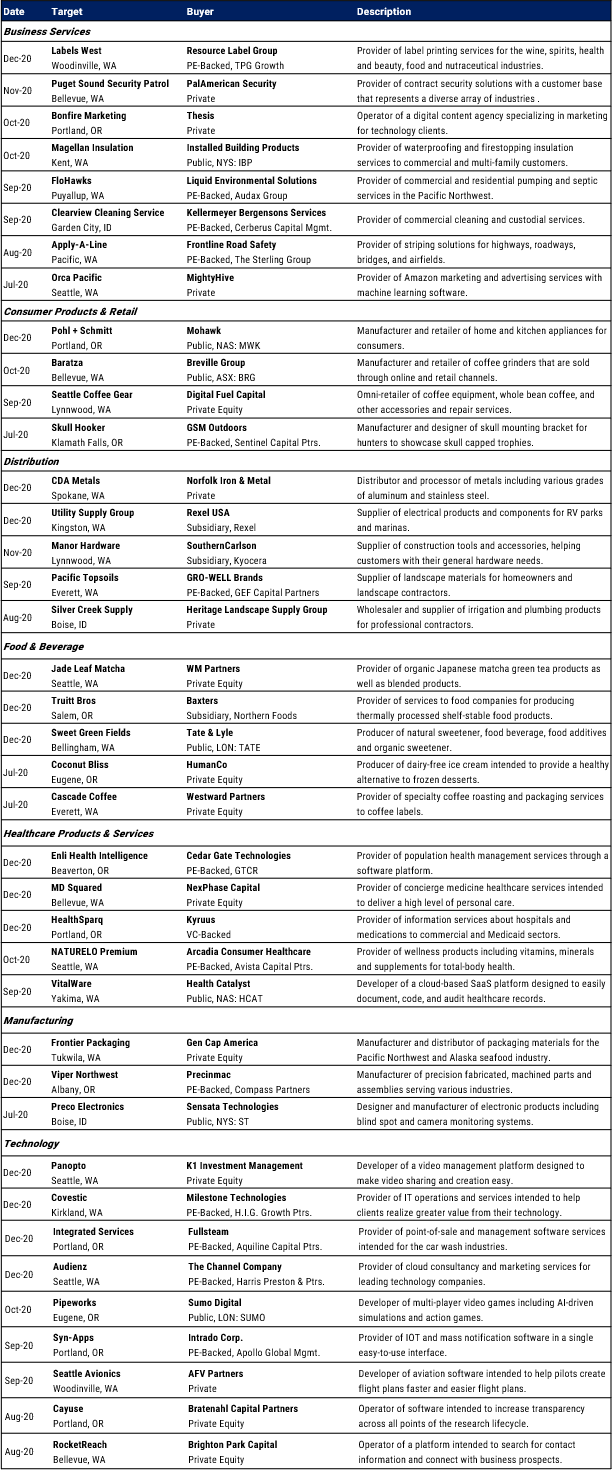
Sources: PitchBook, Portland Business Journal, Puget Sound Business Journal