This report, published twice a year, provides an update on M&A activity for the second half of 2018, focusing on global, national, and Pacific Northwest trends. Selected transactions are profiled with an Enterprise Value (EV) between $10 million and $50 million. Our data is sourced from GF Data, PitchBook and other publications. GF Data is a member-only subset of information that exclusively focuses on private equity transactions.
 GLOBAL & U.S. DEAL VALUE RISES BUT NUMBER OF DEALS FALLS
Global M&A deal value for the full year of 2018 rose to $3.53 trillion, making last year the third-largest year on record since 2001. However, despite the 12% rise from 2017, global deal volume fell for the first time since 2010.
Global M&A Activity (2013-2018)
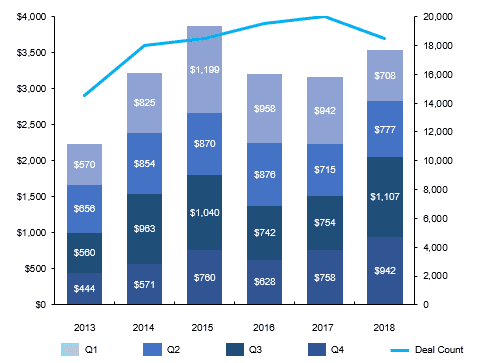 Source: Mergermarket Global & Regional M&A Report 2018
U.S. deal volume also experienced a decline, despite 2018 being the fourth consecutive year with aggregate deal values above $2 trillion. Healthcare and technology mergers drove the larger deal activity during the second half of the year.
U.S. M&A Activity (2008-2018)
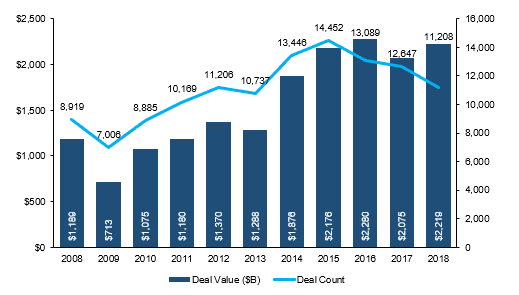 Source: PitchBook 2018 M&A Report
 LOWER-MIDDLE MARKET EBITDA MULTIPLES REMAIN STEADY
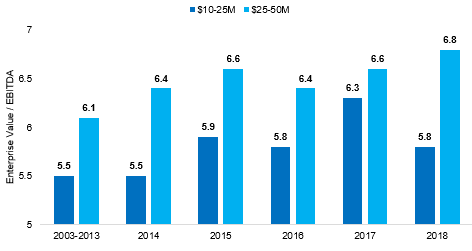
EBITDA multiples for companies with an enterprise value between $10-25 million returned to a 5-year average while larger companies between $25-50 million reached a 5-year high (YTD 2018 5.8x and 6.8x, respectively) in the second half of 2018.
EBITDA Multiples
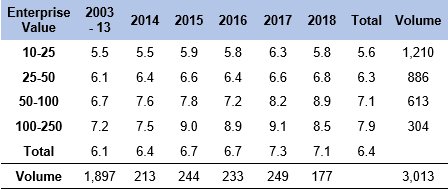 Source: GF Data M&A Report November 2018
Enterprise Value Deal Multiples
 Source: GF Data M&A Report November 2018
 PACIFIC NORTHWEST DEAL VOLUME SLOWS TO 3-YEAR LOW
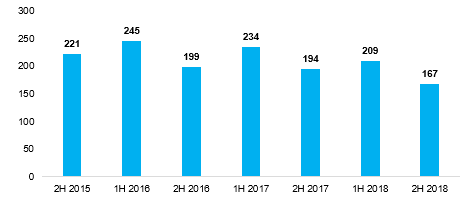
Total deal volume in the Pacific Northwest declined in the second half of 2018, compared to the first half. This follows a trend over the past three years where deal volume for the second half of the year was lower than the first half.
Pacific Northwest Deal Volume
 Source: PitchBook
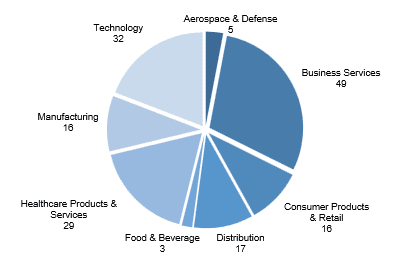
Business Services, Technology, and Healthcare continue to lead the region in M&A activity.
Pacific Northwest Deal Activity by Industry
 Source: PitchBook
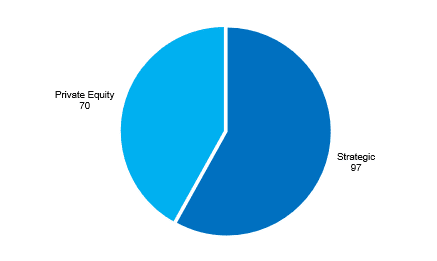
Pacific Northwest Deal Activity by Investor Type
 Source: PitchBook
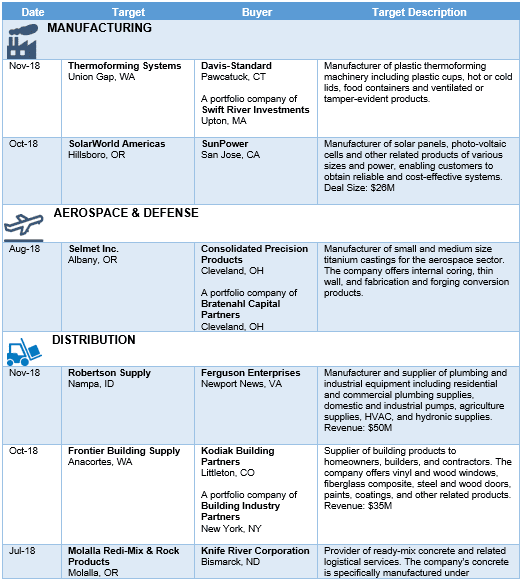
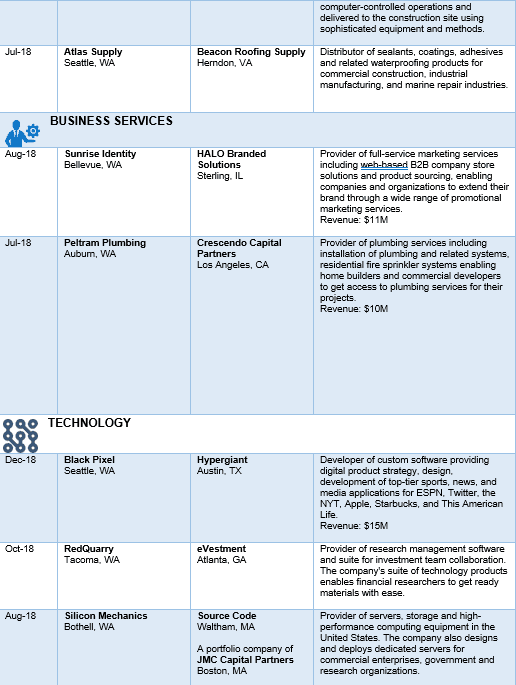
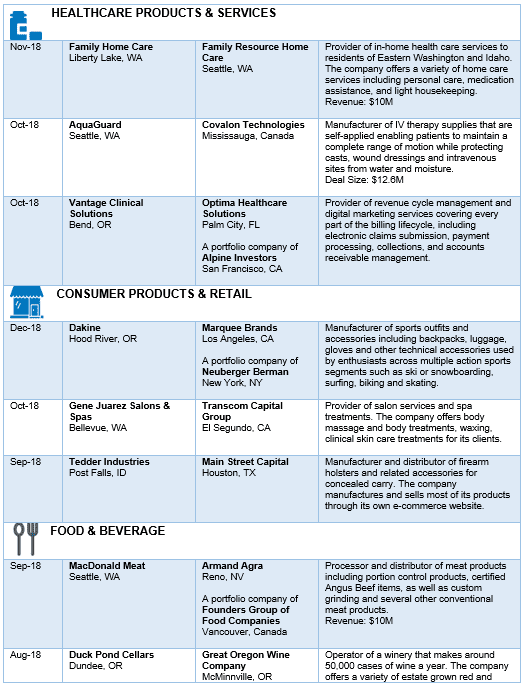
 SELECT 2H 2018 PACIFIC NORTHWEST M&A DEAL ACTIVITY – FOCUS ON TRANSACTIONS WITH AN ENTERPRISE VALUE GENERALLY FROM $10 MILLION TO $50 MILLION
