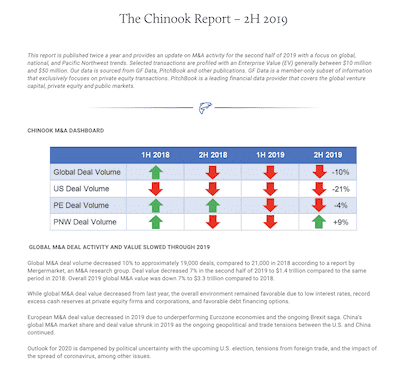
The Chinook Report: 2h 2019
This report is published twice a year and provides an update on M&A activity for the second half of 2019 with a focus on global, national, and Pacific Northwest trends. Selected transactions are profiled with an Enterprise Value (EV) generally between $10 million and $50 million. Our data is sourced from GF Data, PitchBook and other publications. GF Data is a member-only subset of information that exclusively focuses on private equity transactions. PitchBook is a leading financial data provider that covers the global venture capital, private equity and public markets.
 CHINOOK M&A DASHBOARD
 GLOBAL M&A DEAL ACTIVITY AND VALUE SLOWED THROUGH 2019
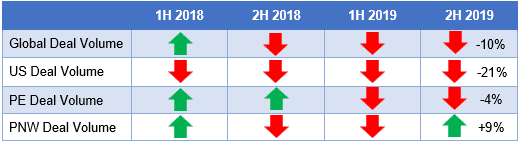
Global M&A deal volume decreased 10% to approximately 19,000 deals, compared to 21,000 in 2018 according to a report by Mergermarket, an M&A research group. Deal value decreased 7% in the second half of 2019 to $1.4 trillion compared to the same period in 2018. Overall 2019 global M&A value was down 7% to $3.3 trillion compared to 2018.
While global M&A deal value decreased from last year, the overall environment remained favorable due to low interest rates, record excess cash reserves at private equity firms and corporations, and favorable debt financing options.
European M&A deal value decreased in 2019 due to underperforming Eurozone economies and the ongoing Brexit saga. China’s global M&A market share and deal value shrunk in 2019 as the ongoing geopolitical and trade tensions between the U.S. and China continued.
Outlook for 2020 is dampened by political uncertainty with the upcoming U.S. election, tensions from foreign trade, and the impact of the spread of coronavirus, among other issues.
Global M&A Activity (2014-2019)
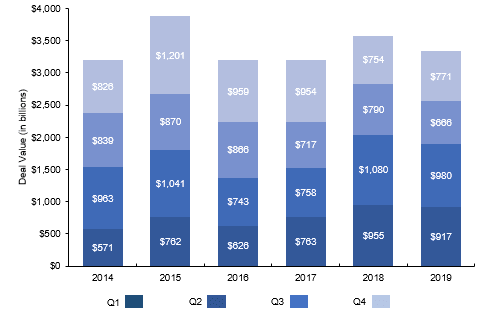 Source: Mergermarket Global & Regional M&A Report 2019
2019 U.S. M&A ACTIVITY REVEALED MIXED PICTURE
2019 U.S. M&A deal volume fell by 21% to 9,022 from 11,438 in 2018. U.S. aggregate M&A deal value reached $1.8 trillion in 2019, nearly 20% lower than $2.2 trillion in 2018, the lowest level in four years according to PitchBook. There was $948 billion of deal activity in the second half of 2019, 17 percent more than the $813 billion in the first half of the year.
While overall deal activity declined, 67% of 2019 U.S. M&A value came from mega deals above $10 billion totaling $1.2 trillion in enterprise value. 30% of those mega deals closed during the second half of the year. According to Bloomberg, 15 mega deals were both announced and completed in 2019, completing customary regulatory hurdles in the same year.
U.S. equity markets finished 2019 at record highs with the S&P 500 recording 32% growth compared to the beginning of the year. This also attributed strategic and financial buyers to capitalize on economic conditions and pursue M&A opportunities.
US M&A Activity (2008-2019)
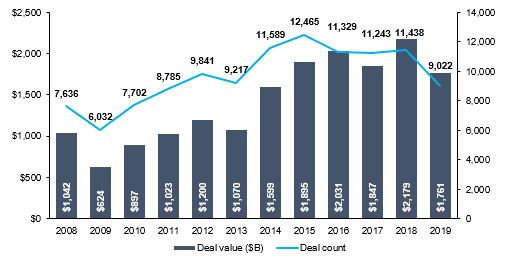 Source: PitchBook 2019 Annual North American M&A Report
U.S. PRIVATE EQUITY DEAL ACTIVITY DROPPED IN 2019
U.S. private equity deal volume dipped 4% in 2019 to 5,133 deals, compared to 5,345 in 2018, according to PitchBook. Deal value also dropped 7% in 2019 to $678 billion compared to $730 billion in 2018.
Deal volume for transactions below $100 million decreased by 20% to 2,948 deals from 3,678 the previous year. 55% of volume was through add-on acquisitions, 27% were buyouts, and 18% were growth capital transactions.
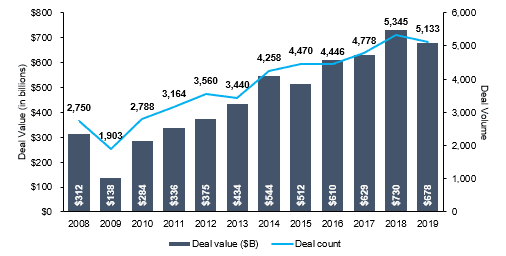 Source: PitchBook Annual 2019 US PE Breakdown
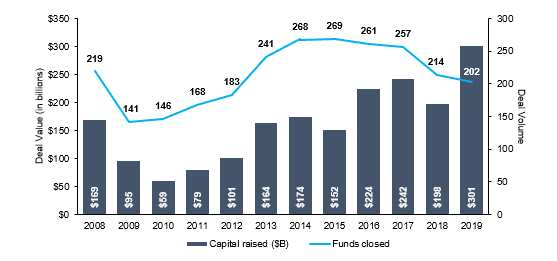
U.S. PRIVATE EQUITY FIRMS RAISED RECORD FUNDS IN 2019
Despite the decrease in deal activity, U.S. private equity funds raised a record $301 billion in 2019 to finance future investment opportunities. In 2019, 202 funds closed and are no longer fundraising or accepting additional commitments, the lowest level since 2013.
US PE Annual Fundraising Activity (2008-2019)
 Source: PitchBook Annual 2019 US PE Breakdown
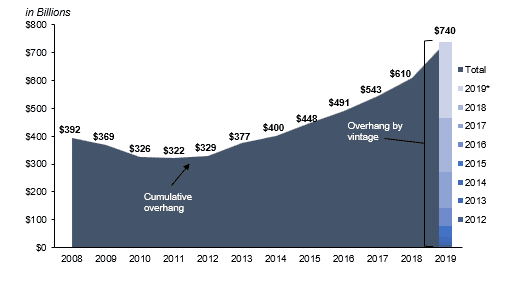
U.S. DRY POWDER CONTINUES TO BREAK RECORD HIGHS
Cumulative dry powder reserves continue to reach record highs as private equity looked for opportunities to deploy capital and deliver returns for investors. In 2019, cumulative dry powder in the United States reached $740 billion, a 21% increase from the previous year.
US Cumulative Dry Powder (2008-2019)
 Source: PitchBook
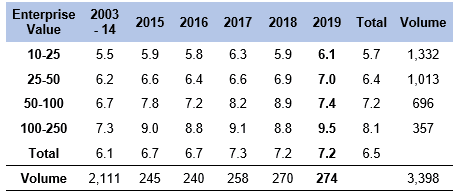
LOWER-MIDDLE MARKET EBITDA MULTIPLES BOUNCE BACK
Average EBITDA multiples paid through 2019 by private equity groups for companies with an enterprise value between $10-25 million reached 6.1x, slightly upward compared to last year. In addition, multiples for companies with an enterprise value between $25-50 million slightly increased at 7.0x compared to 2018.
EBITDA Multiples
 Source: GF Data M&A Report February 2020
PACIFIC NORTHWEST DEAL VOLUME REBOUNDS
Total deal volume in the Pacific Northwest increased to 182 transactions in the second half of 2019 compared to 167 during the second half of 2018. This is the first increase in volume since the first half of 2018.
Pacific Northwest Deal Volume
 Source: PitchBook
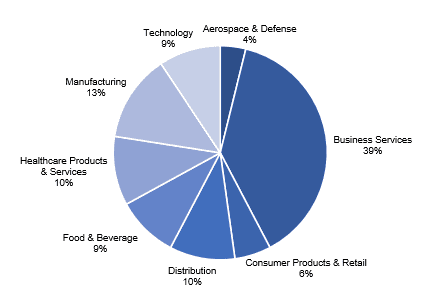
BUSINESS SERVICES DEALS LEAD PACIFIC NORTHWEST REGION
Business Services dominated the region in M&A activity, while other usually active industries like Technology and Healthcare stagnated.
2H 2019 Pacific Northwest Deal Activity by Industry
 Source: PitchBook
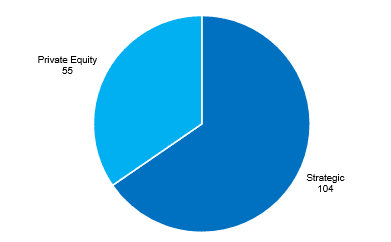
STRATEGIC BUYERS REPRESENT MAJORITY OF PNW DEALS
On average, private equity transactions represented 35% of deal activity in the Pacific Northwest. In 2019, private equity represented 33% of all regional deals.
Pacific Northwest Deal Activity by Investor Type
 Source: PitchBook
SELECT 2H 2019 PACIFIC NORTHWEST M&A TRANSACTIONS
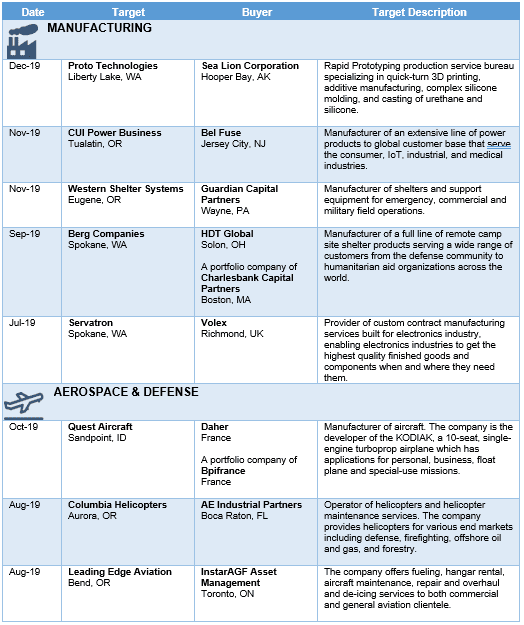
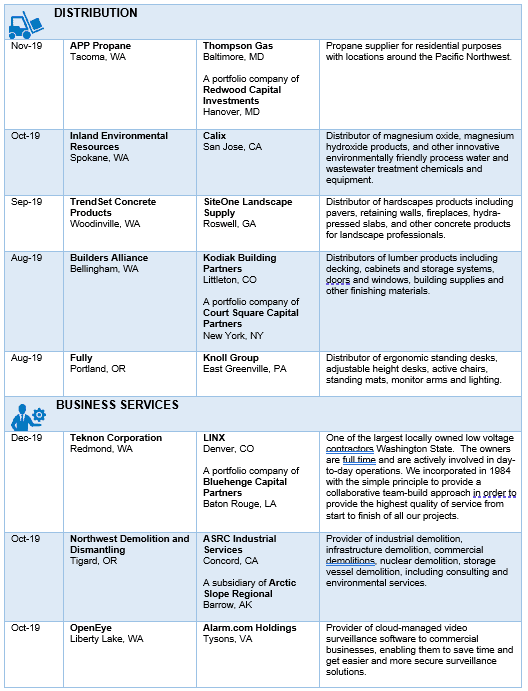
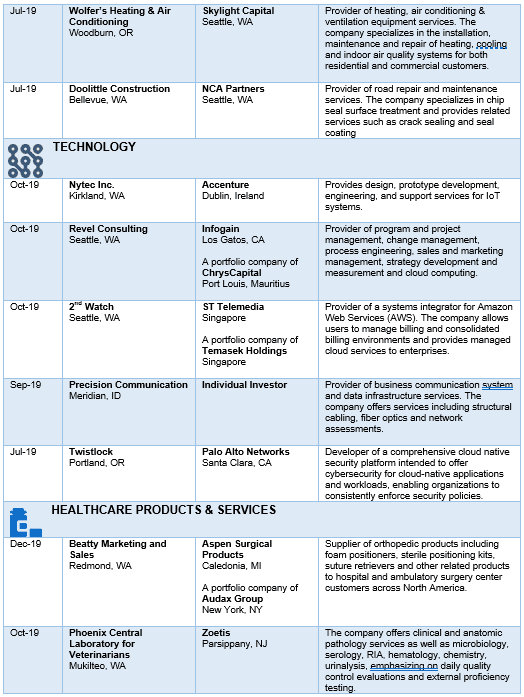
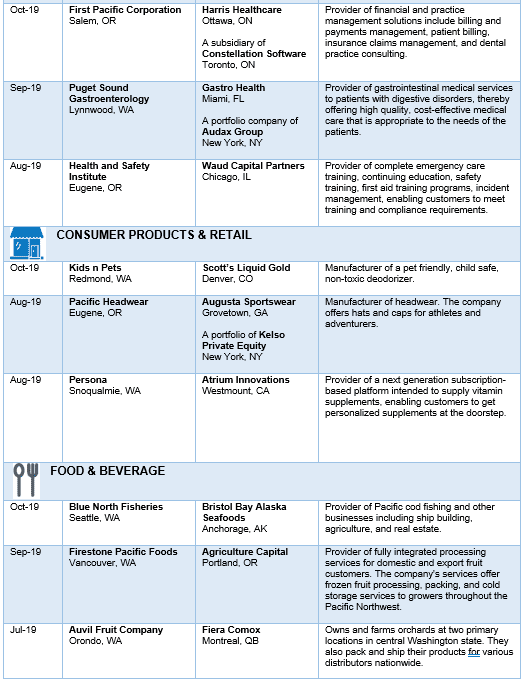
Sources: PitchBook, Portland Business Journal, Puget Sound Business Journal