This report is published twice a year and provides an update on M&A activity for the first half of 2019 with a focus on global, national, and Pacific Northwest trends. Selected transactions are profiled with Enterprise Values (EV) between $10 million and $50 million. Data is sourced from GF Data, PitchBook, and other publications. GF Data is a member-only subset of information that exclusively focuses on private equity transactions. PitchBook is a financial data provider that covers the global venture capital, private equity, and public markets.
 GLOBAL M&A DEAL VALUE DECREASED IN Q1 2019 COMPARED TO Q1 2018, OUTLOOK REMAINS CAUTIOUS
After a peak in the M&A cycle during the first half of 2018, economic headwinds continued to weigh down deal activity along with greater market volatility, geopolitical tensions between the US and China, and Brexit anxiety in Europe. Cross-border M&A activity continues to fall, given a significant slowdown of outbound acquisitions by China.
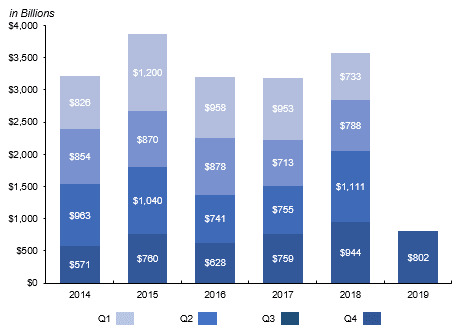
Global M&A deal value decreased in Q1 2019 with 3,558 deals valued at $802 billion, a 15% decrease compared to the 5,085 deals closed in Q1 2018. Despite the slowdown, 2019 could end the year with a total deal value similar to 2018 as Private Equity (PE) groups look to deploy record amounts of dry powder.
Global M&A Activity (2014-2019)
 Source: Mergermarket Global & Regional M&A Report 1Q 2019
GLOBAL DRY POWDER CONTINUES TO REACH ALL-TIME HIGHS
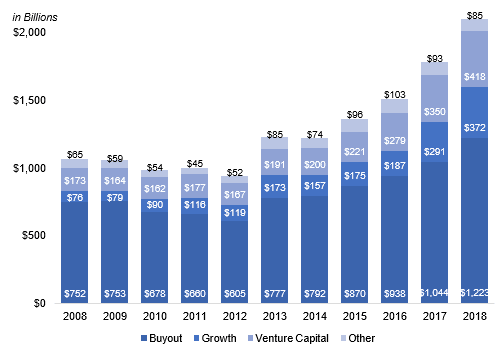
Global dry powder, the amount of capital private equity firms have available for acquisitions, continues to break records. The global dry powder is estimated to be $2.4 trillion as of June 2019.
Global Dry Powder By Fund Type (2008-2018)
 Source: Preqin Alternatives in 2019: Private Capital Dry Powder Reaches $2tn
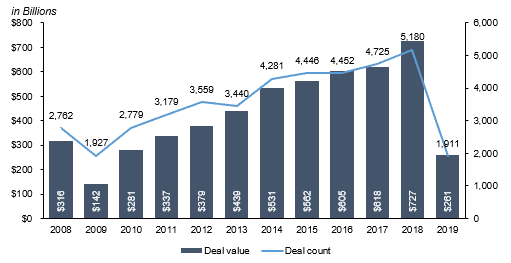
1H 2019 U.S. DEAL VOLUME DECREASED COMPARED TO 2018
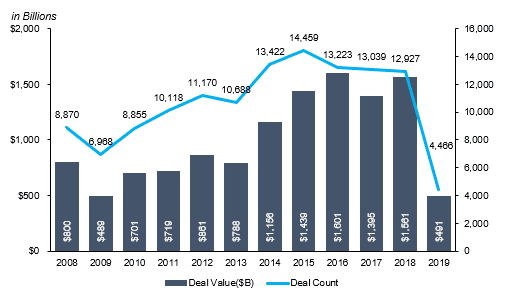
U.S. deal volume decreased from 6,892 in 1H 2018 to 4,466 deals in 1H 2019. Moreover, the aggregate deal value decreased by 23 percent to $491 billion while the median deal size increased to $90 million.
U.S. M&A Activity (2008-2019)
 Source: PitchBook 2019 M&A Report
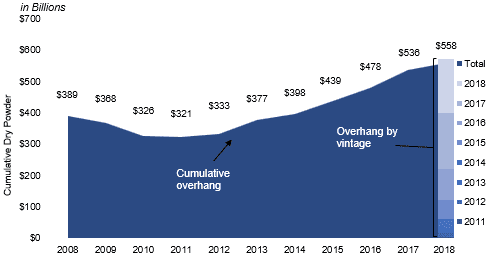
U.S. MIDDLE MARKET PRIVATE EQUITY DEALS FELL IN 1H 2019
The number of private equity deals valued below $100 million decreased by 30 percent to 1,222 in 2019 compared to 2018. Of the 1,222 deals, 55 percent were add-on transactions, 24 percent were buyouts and 21 percent were PE growth expansions. Dry powder has continued to increase since 2011, and with access to capital at record highs, competition between strategic and PE groups for acquisitions continues. One-third of the $558 billion in U.S. dry powder at the end of 2018 was raised throughout the year.
U.S. PE Deal Activity (2008-2019)
 Source: PitchBook
U.S. Cumulative Dry Powder (2008-2018)
 Source: PitchBook
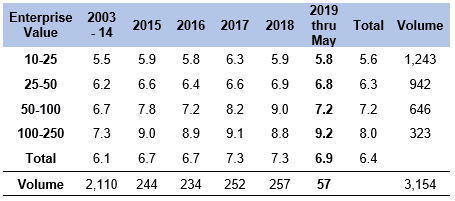
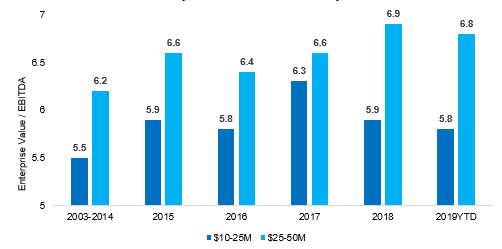
LOWER-MIDDLE MARKET EBITDA MULTIPLES REMAIN STABLE
EBITDA multiples paid through May 2019 by Private Equity groups for companies with an enterprise value between $10-25 million and $25-50 million remained overall stable at 5.8x and 6.8x respectively compared to 2018.
EBITDA Multiples
 Source: GF Data M&A Report May 2019
Enterprise Value Deal Multiples
 Source: GF Data M&A Report May 2019
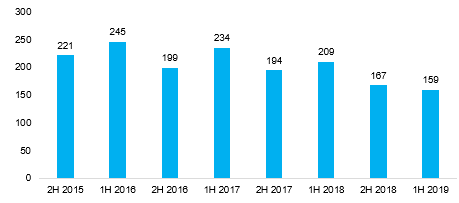
PACIFIC NORTHWEST DEAL VOLUME CONTINUES TO DECLINE
Total deal volume in the Pacific Northwest declined to 159 transactions in the first half of 2019 compared to the 209 transactions made in the first half of 2018. Deal volume has declined in each half-year period since the first half of 2018.
Pacific Northwest Deal Volume
 Source: PitchBook
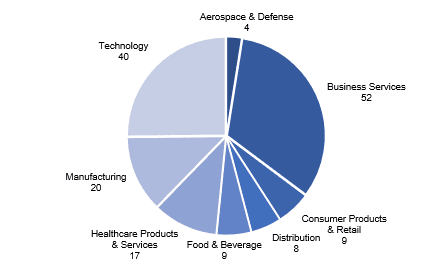
Business Services, Technology, and Healthcare continue to lead the region in M&A activity.
Pacific Northwest Deal Activity By Industry
 Source: PitchBook
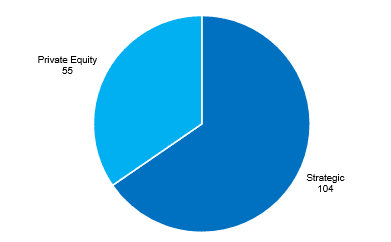
1H 2019 Pacific Northwest Deal Activity By Investor Type
 Source: PitchBook
SELECT 1H 2019 PACIFIC NORTHWEST M&A DEAL ACTIVITY – FOCUS ON TRANSACTIONS WITH AN ENTERPRISE VALUE GENERALLY FROM $10 MILLION TO $50 MILLION
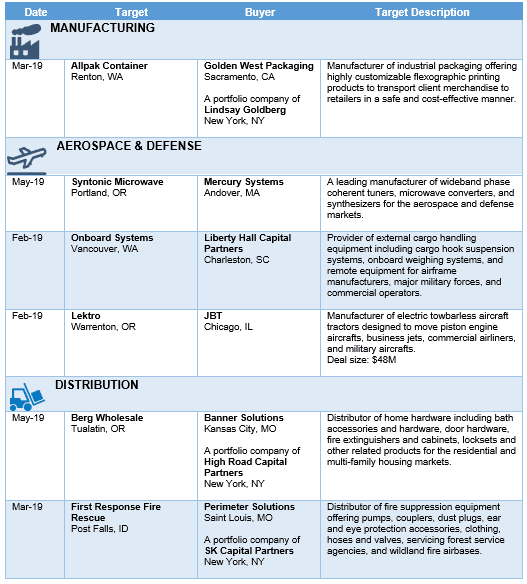
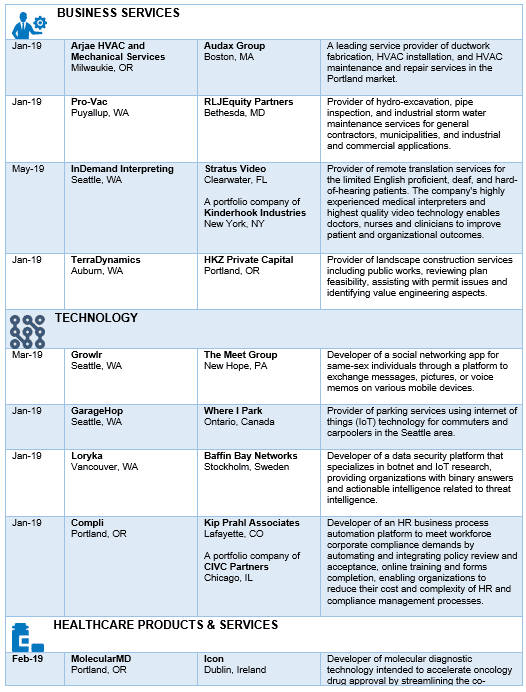
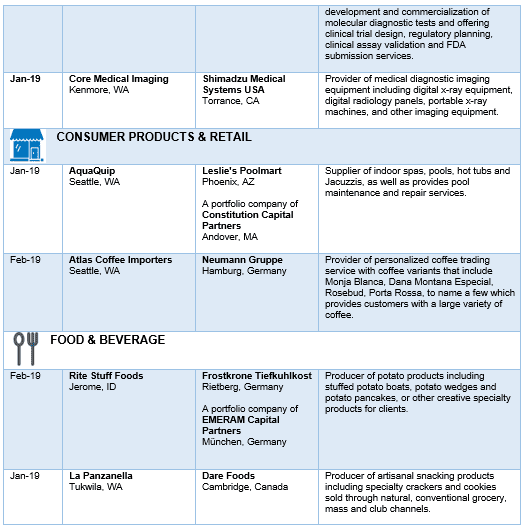
Sources: PitchBook, Portland Business Journal, Puget Sound Business Journal